AUDUSD – from the beginning of this year, the pair moves in a downward trend, and from mid-June, we can draw a regular downward channel, whose upper (resistance) and lower (support) limits are fairly accurately respected. In the past week, the quotations reached the supply zone determined by the maximum from 26.09 at 0.7315. This is a level that has been a strong support/resistance several times this year. If the maximum appears on the MACD (red bar in the histogram) it may be a signal for sell.
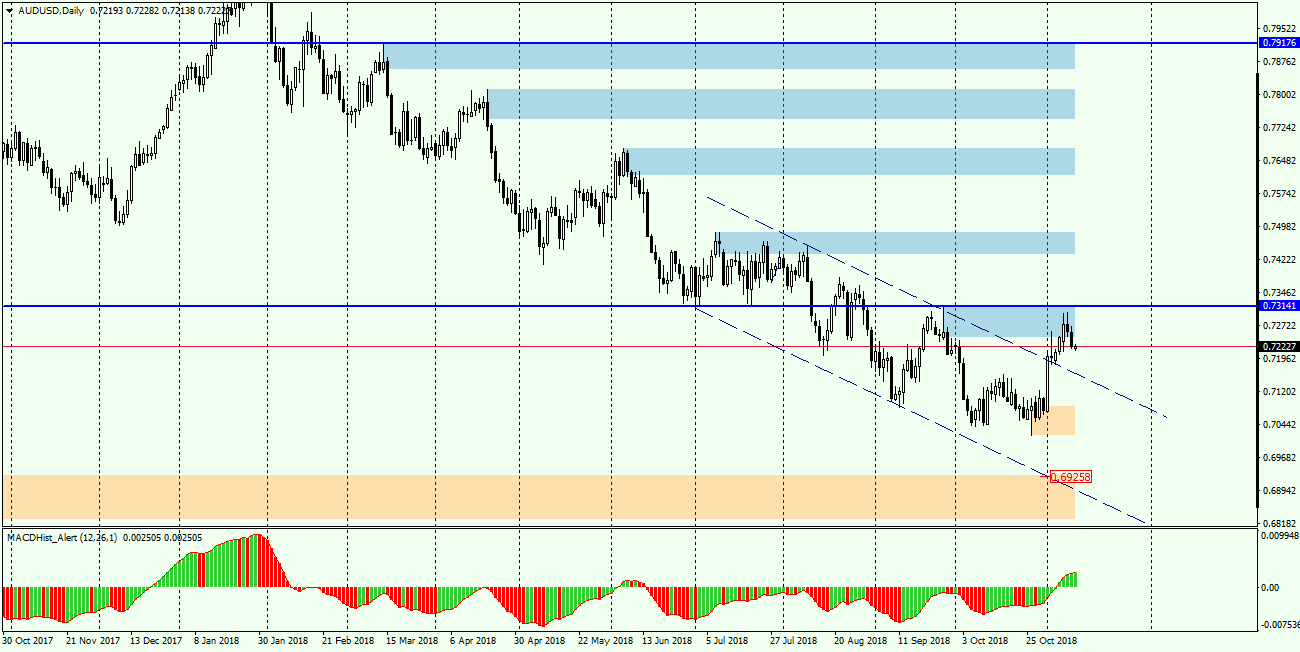
There is a clear downward divergence on the H4 chart. The target for possible decreases may be the upper limit of the channel, which will now be a support at 0.7150. It is worth paying attention to the average EMA144, which may also constitute a dynamic resistance and the quotations may, after reaching it, change direction to the north, especially since it has been quite thoroughly tested before (chart H4). The limit that can negate declines is the above-mentioned 0.7315 level.
Join us for new analyses and education content
https://www.facebook.com/groups/


 Review")


