AUDUSD has been in a downward trend since December 2018. During this time the price has fallen by more than 700p. What is interesting, the pair is currently in the vicinity of the level on which they pair was for a while during the flash-crash, which took place almost 10 months ago – 3 January 2019.
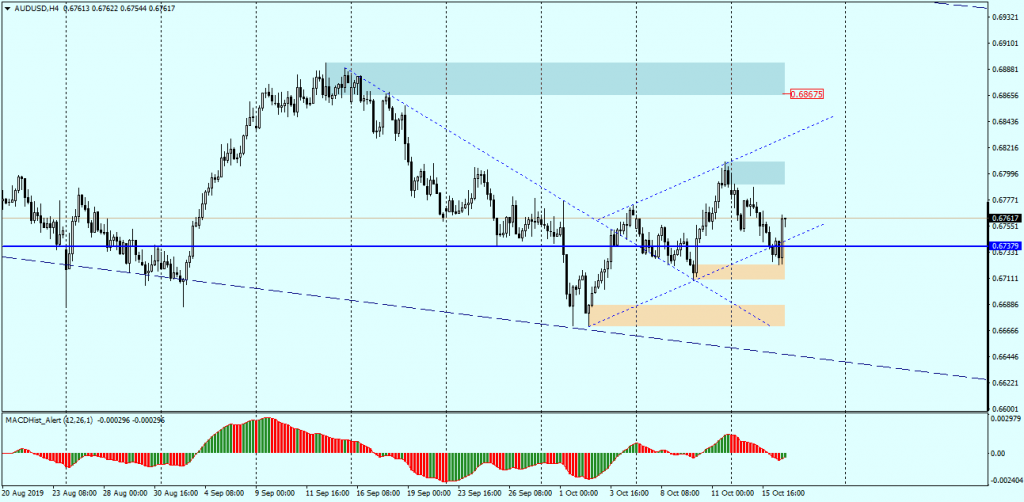
On chart H4 we can determine the local downward trend line, which was defeated on 4 October and then was tested several times from above. Currently, the price has started a correction with some hesitation and moves in the growth channel.
XM offers traders minimum deposits from $5 and security through CySEC, ASIC and FCA licenses. Trade with a broker with 10 years of market tradition and more than 2.5 million clients worldwide
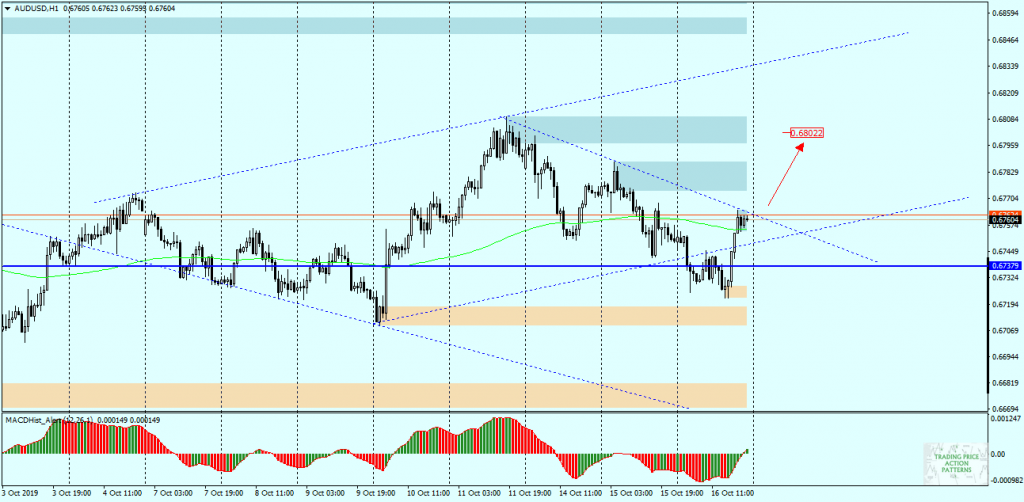
On chart H1 we can see that the price is below the next local downward trend line. If it is overcome, we can expect a continuation of the upward trend correction. The growth scenario is supported by today’s information about the close conclusion of the USA trade agreement China and additionally by the growth divergence on the daily chart.
When planning orders for this pair, one should take into account the macro events – planned speech by Guy Debelle Assistant Governor (Financial Markets) from the Reserve Bank of Australia at 00:10 a.m. and data from the labour market, which is published at 3:00 GMT+2.
In our Facebook group, which you can join anytime: https://www.facebook.com/groups/328412937935363/ you will find 5 simple strategies on which my trading is based. There, every day we post fresh analyses of currency pairs and commodities


 Review")


