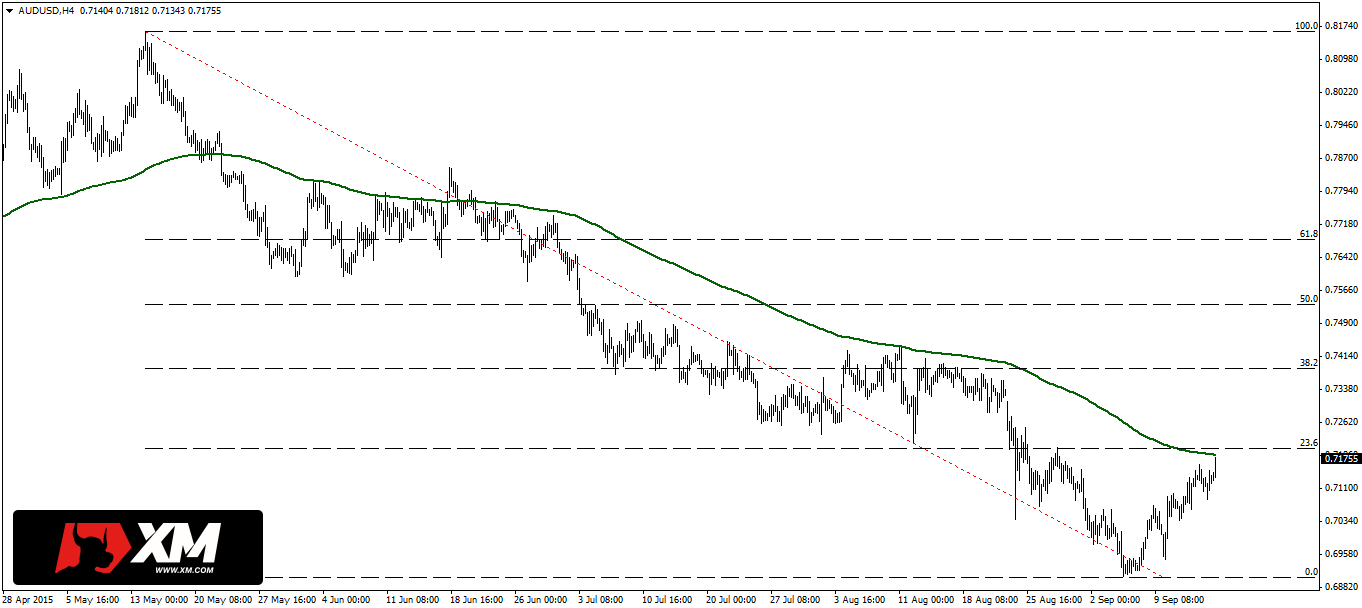
On H4 chart of AUDUSD we can see that price again is close to moving average 200EMA. On the first chart it is showed from large distance to show that since May 2015 when price went below 200EMA it is respected as key resistance. After marking these year bottoms (above 0.6682) quotes again were going back to moving average area (now it is on 0.7187). Wider perspective shows that resistance created by MA also covers 23,6% retracement of downtrend existing since May.
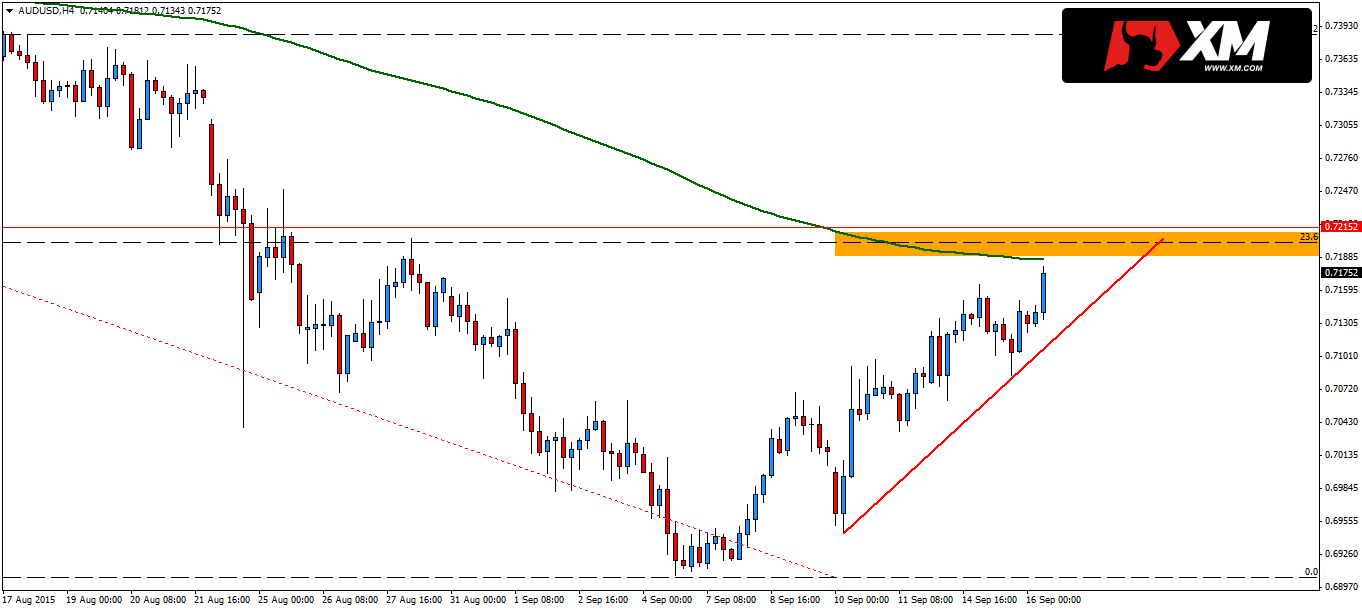
When we zoom chart, we can also notice that right above resistance area Fibo + 200EMA there is local resistance level strengthen this area (0.7215). Surely it is worth to observe what will happen on the chart and in the mentioned area, we should look for sell signals – drops are main tendency on AUDUSD at the moment.
![]()
![]() This analysis was created in cooperation with XM. Open account right now here.
This analysis was created in cooperation with XM. Open account right now here.


 Review")


