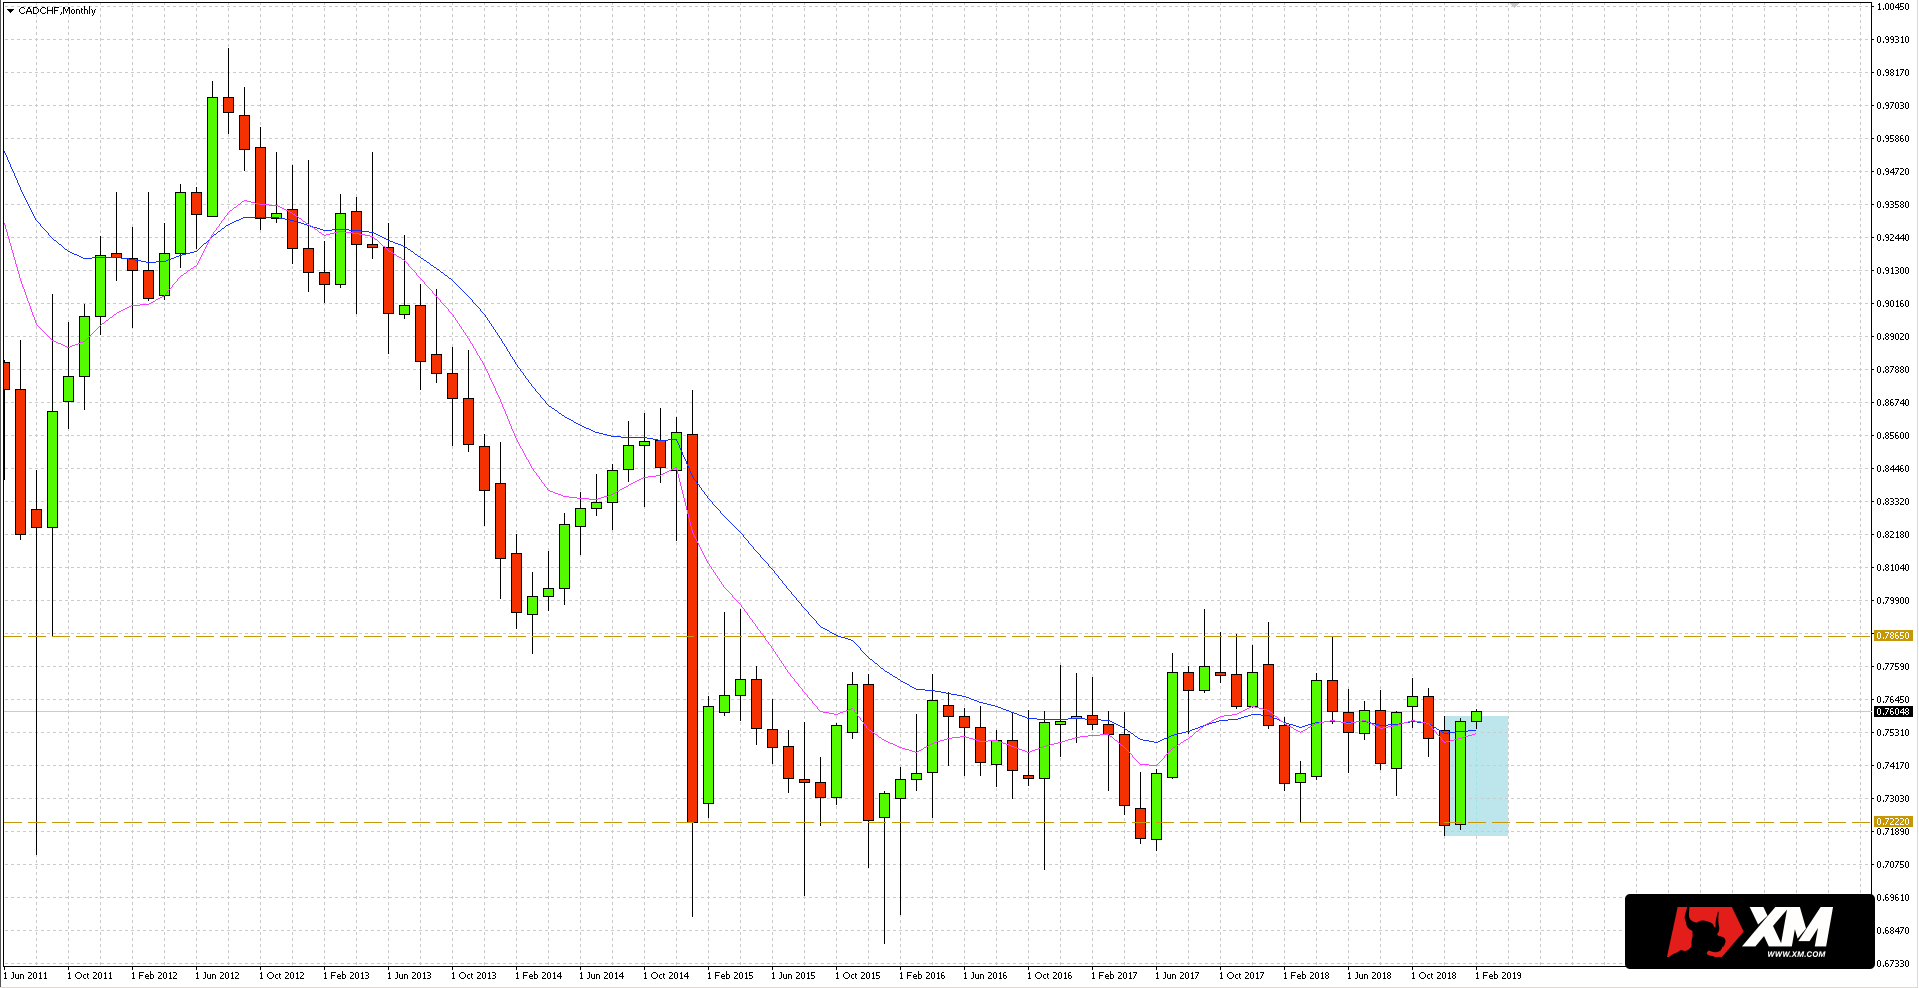
CAD/CHF currency pair quotations slipped until the close of 2018, which took place within the support zone at 0.7222. However, already at the beginning of this year, buyers appeared again on the market, who managed to make up for the losses of the previous month.
The monthly chart shows the inside bar, where the January candle is fully covered by the December trading range. However, the January candle body is larger than the previous one, which indicates the strength of the demand side and gives the potential for movement to the key resistance at 0.7865.
However, before buyers are able to reach the target mentioned above, another obstacle awaits them. We mean the resistance from the weekly chart at 0.7676. As you can see below, the October and August maxima of last year are concentrated within this level.
Alternatively, an unsuccessful top breakout from an inside bar formation may result in a renewed key support/bottom limit consolidation test at 0.7222.


 Review")


