Al Brooks Price Action – Learn how to trade a wedge top
The daily chart is overbought and in a resistance area. The odds are that it will pull back for at least a few days,...
Al Brooks Price Action: Emini formation fail
I had to leave 45 minutes early today. Today was an outside up day. I have been saying that the 60 minute Head and...
Al Brooks Price Action: Waiting for Brexit
Tuesday was a trading range day. The Emini is trying to be neutral going into the Brexit vote on Thursday. Hence, tomorrow will also...
Al Brooks Price Action – Summary of Tuesday’s S&P500 trading and what to expect...
I said yesterday that the Emini probably would trigger the weekly sell signal by falling below last week’s low early this week, but the...
Al Brooks Price Action: S&P500 Emini weekly update
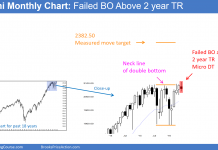
Monthly S&P500 Emini futures candlestick chart: Failed breakout
The monthly S&P500 Emini futures candlestick chart has a micro double top with the April high at...
Al Brooks Price Action: Zero Sum Game and Eternal Bull Market
The Dow will break strongly above 20,000, even if it falls to 10,000 first! That is because the world creates more workers in an...
Al Brooks Price Action: Double bottom on the chart
The Emini had a wedge lower high major trend reversal that was followed by a strong bear breakout and measured move down midday. It...
Weak Signals Need Strong Breakouts
This chart shows prices from April 2014.
The exact rates are important, but the strategy that Al Brooks is trying to describing is vital...
Al Brooks Price Action – Learn how to trade exhaustion
The Emini began with a reversal down and a reversal up in a narrow range at the support of level of the August 17...
Emini weekend update: Candlestick pattern is a bull trend reversal in a trading range
Monthly S&P500 Emini futures candlestick chart: Pullback to moving average after buy climaxThe daily S&P500 Emini futures candlestick chart reversed up strongly from the...


