Divergence provides clues not answers
Charts are merely graphical representations of the price of an asset over a defined period. Some novice traders get things a little “muddled”.
An indicator is just that it indicates an event. That event maybe the continuation of a trend a breakout, a reversal, a top or bottom. Nothing is certain. Just at the very point a whole series of indicators predict a rally in a currency pair an event could take place which negates everything. The price changes and new indicators or signals arrive.
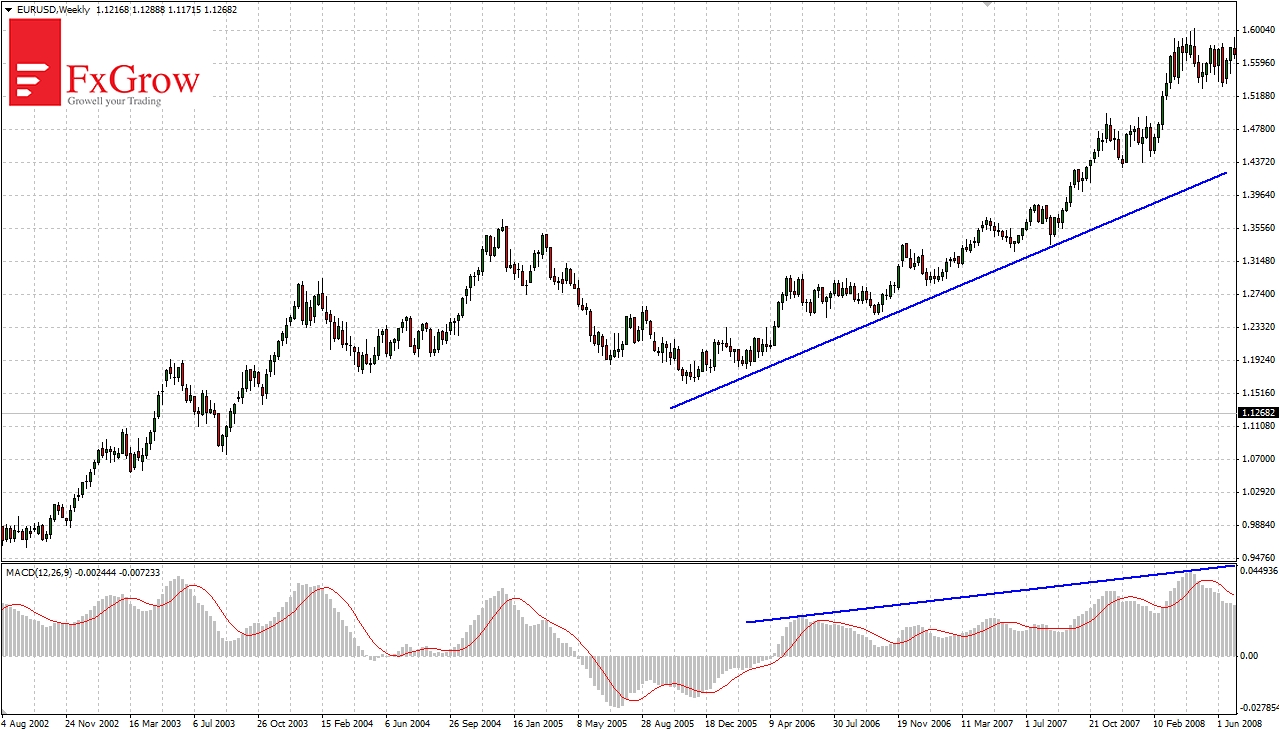
This is an example of the underlying and an indicator moving in the same direction. In this case, Eur/Usd and the moving average convergence/divergence (MACD) indicator (blue lines on chart):
Depending on the time interval, divergence can last for a long time. Therefore, observing the inconsistency between the price and an indicator should not be a final signal for traders. However it is the first signal that the current trend is weakening and may retrace in the near future.
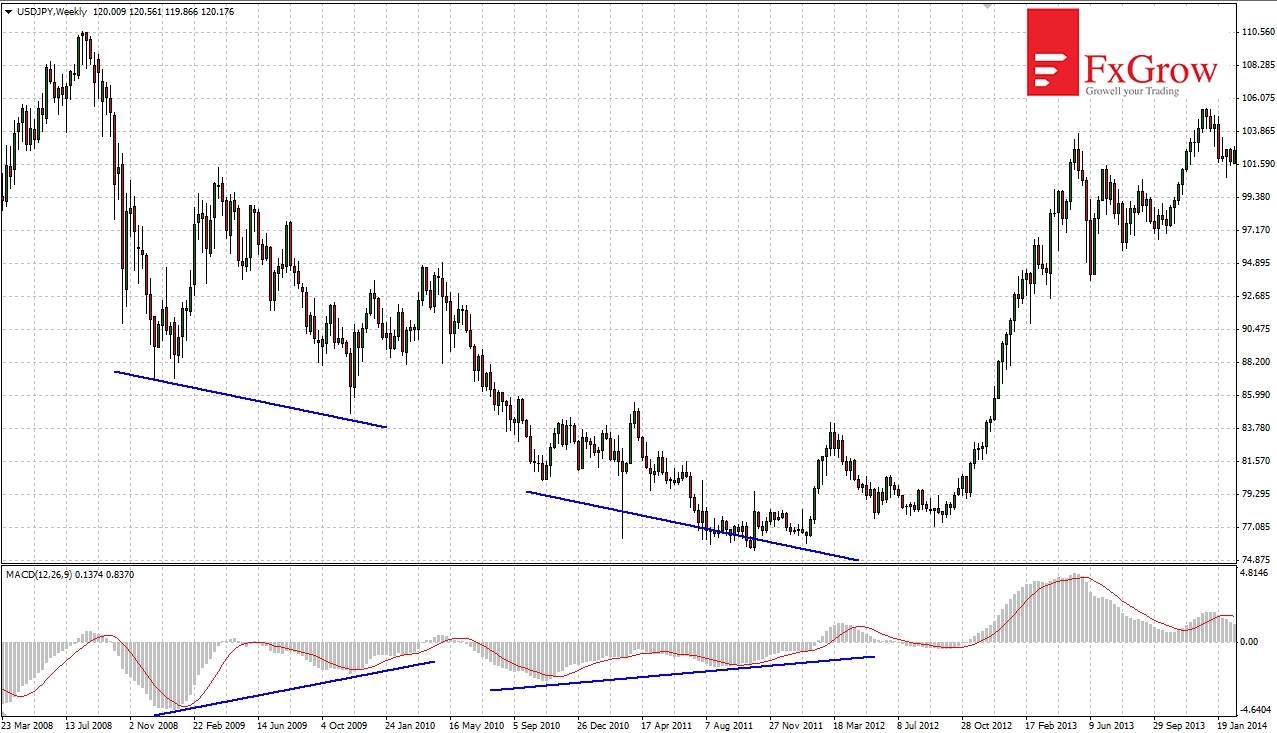
In the example below, the divergence between USDJPY and the MACD indicator on the weekly interval lasted more than three years before the downward trend finished and the price began to rise. The discrepancy between the prices behaviour and the indicator has been marked by blue lines on the chart.
Using additional confirmation, detection of divergence can help in trading. In the above example, discrepancy was the first signal, but break above uptrend line confirmed change in trend.


