Welcome to weekly market overwiev, where we look for Price Action patterns and/or use Elliott Wave Theory.
EURUSD
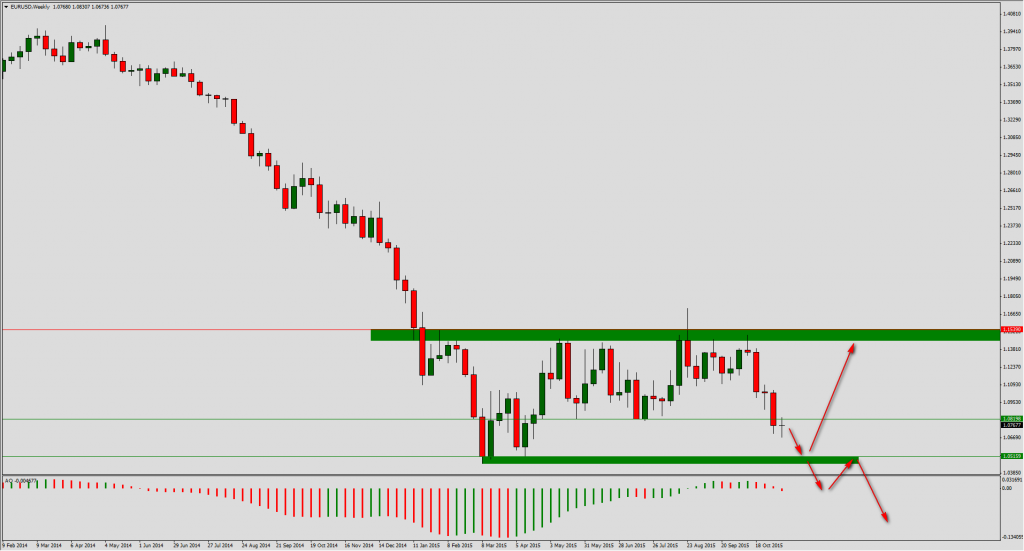
This pair still stays in wide consolidation. Currently pair chart broke support and we will see consequences today. We have to remember that the most important support for this pair is 250 pips lower.
GBPJPY
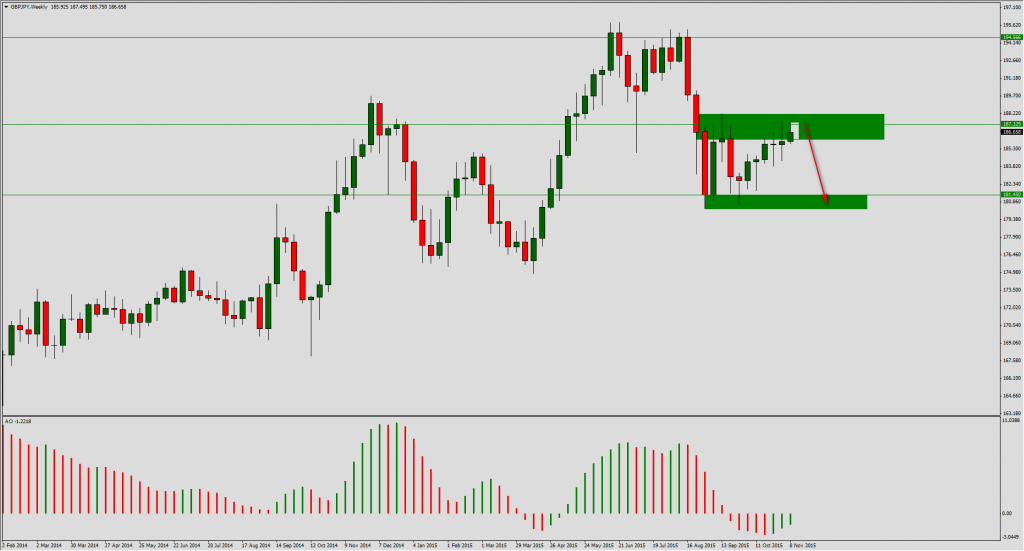
Pair reached to resistance area. It is possible that there is ABC pattern being created which is correction of bearish impulse started on August.
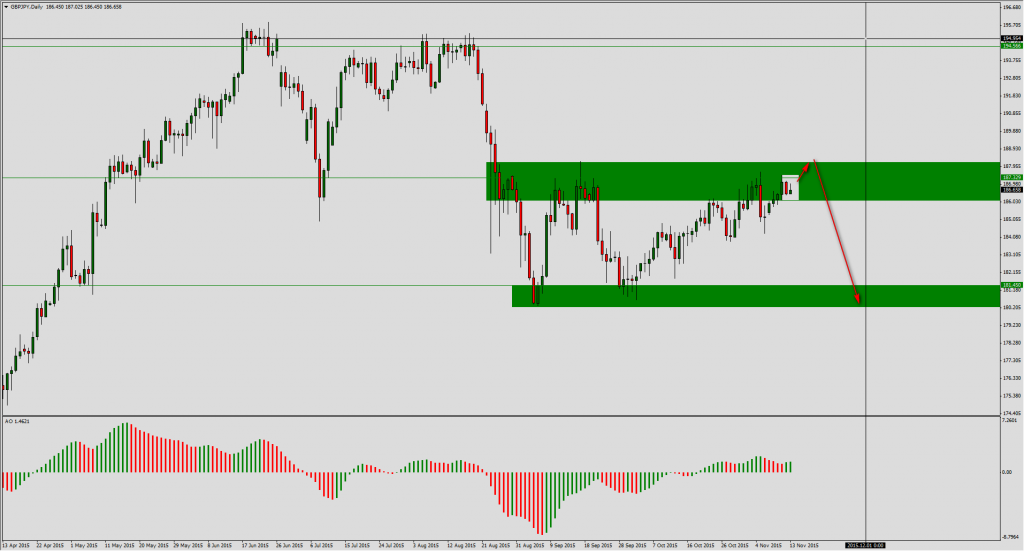
[pullquote align=”left” cite=”” link=”” color=”” class=”” size=””]Get 25USD for free and try Elliott Wave Strategy![/pullquote]On the daily chart we can see Inside Bar which we can try to play with minimal target set on the closest support (last low).
EURJPY
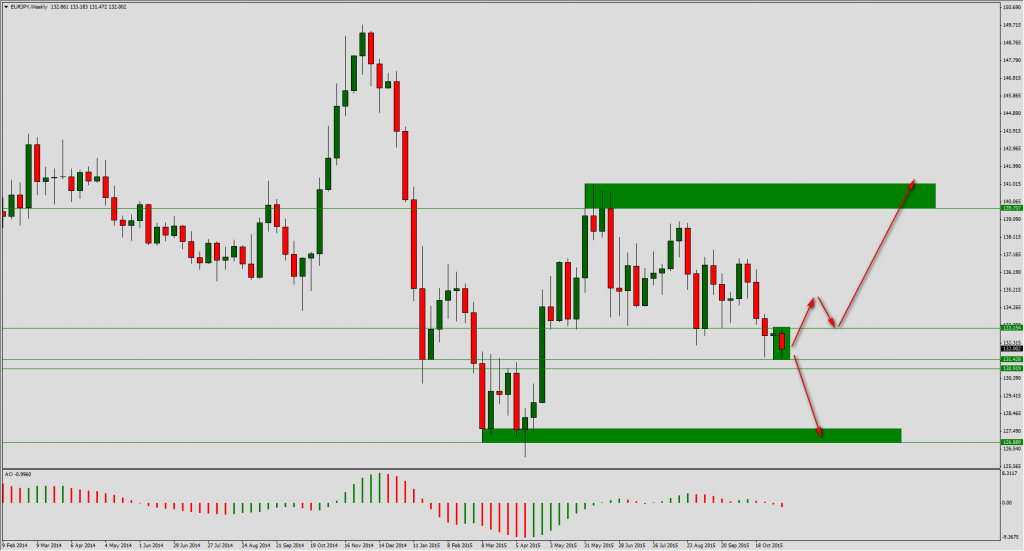
Chart is between resistance and support. On the weekly chart we can see Inside Bar. We have to wait for break and then look for position to enter the market according to the direction of movement.
USDCAD
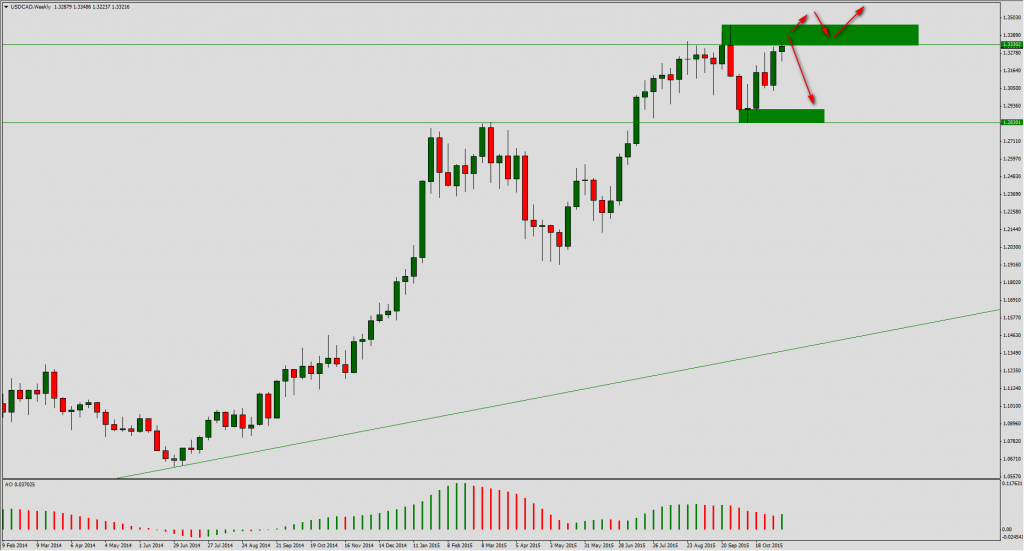
We are getting slowly to important resistance area. We can start looking for proper setup to open short position. Stronger breaking move will change sentiment on this pair to bullish.
AUDNZD
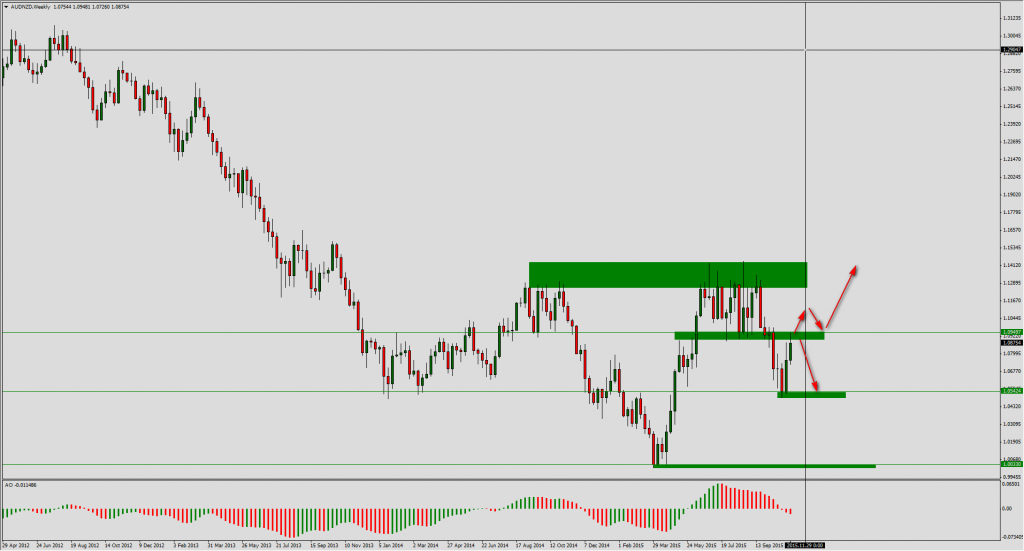
This pair is testing last support which became resistance. If bearish movement is going to be continued it is great place to open position. If resistance will be broken, its re-test from above will be great chance to open long position because there we can see big Head and Shoulders pattern and last decrease could be its right shoulder.
GBPUSD
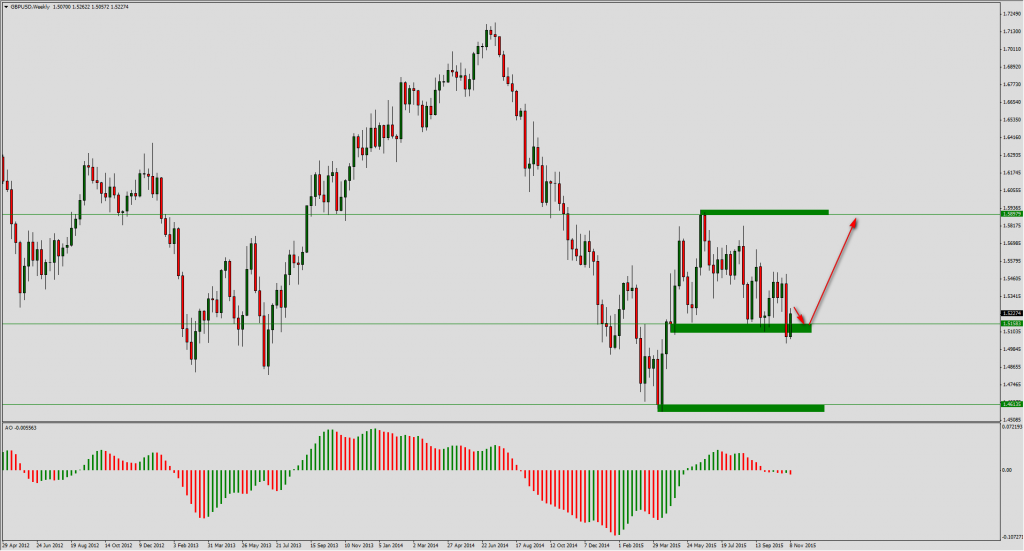
This pair looks very interesting. We can see reaction to support and breaking above it. Up movement has 5 wave structure and is a possibility to open long position. It can be beginning of continuation of movement started in April.


