In below article we will describe GBP/JPY chart (on different TFs) using Elliott Wave Theory – you can read about waves and the whole strategy here.
GBP/JPY
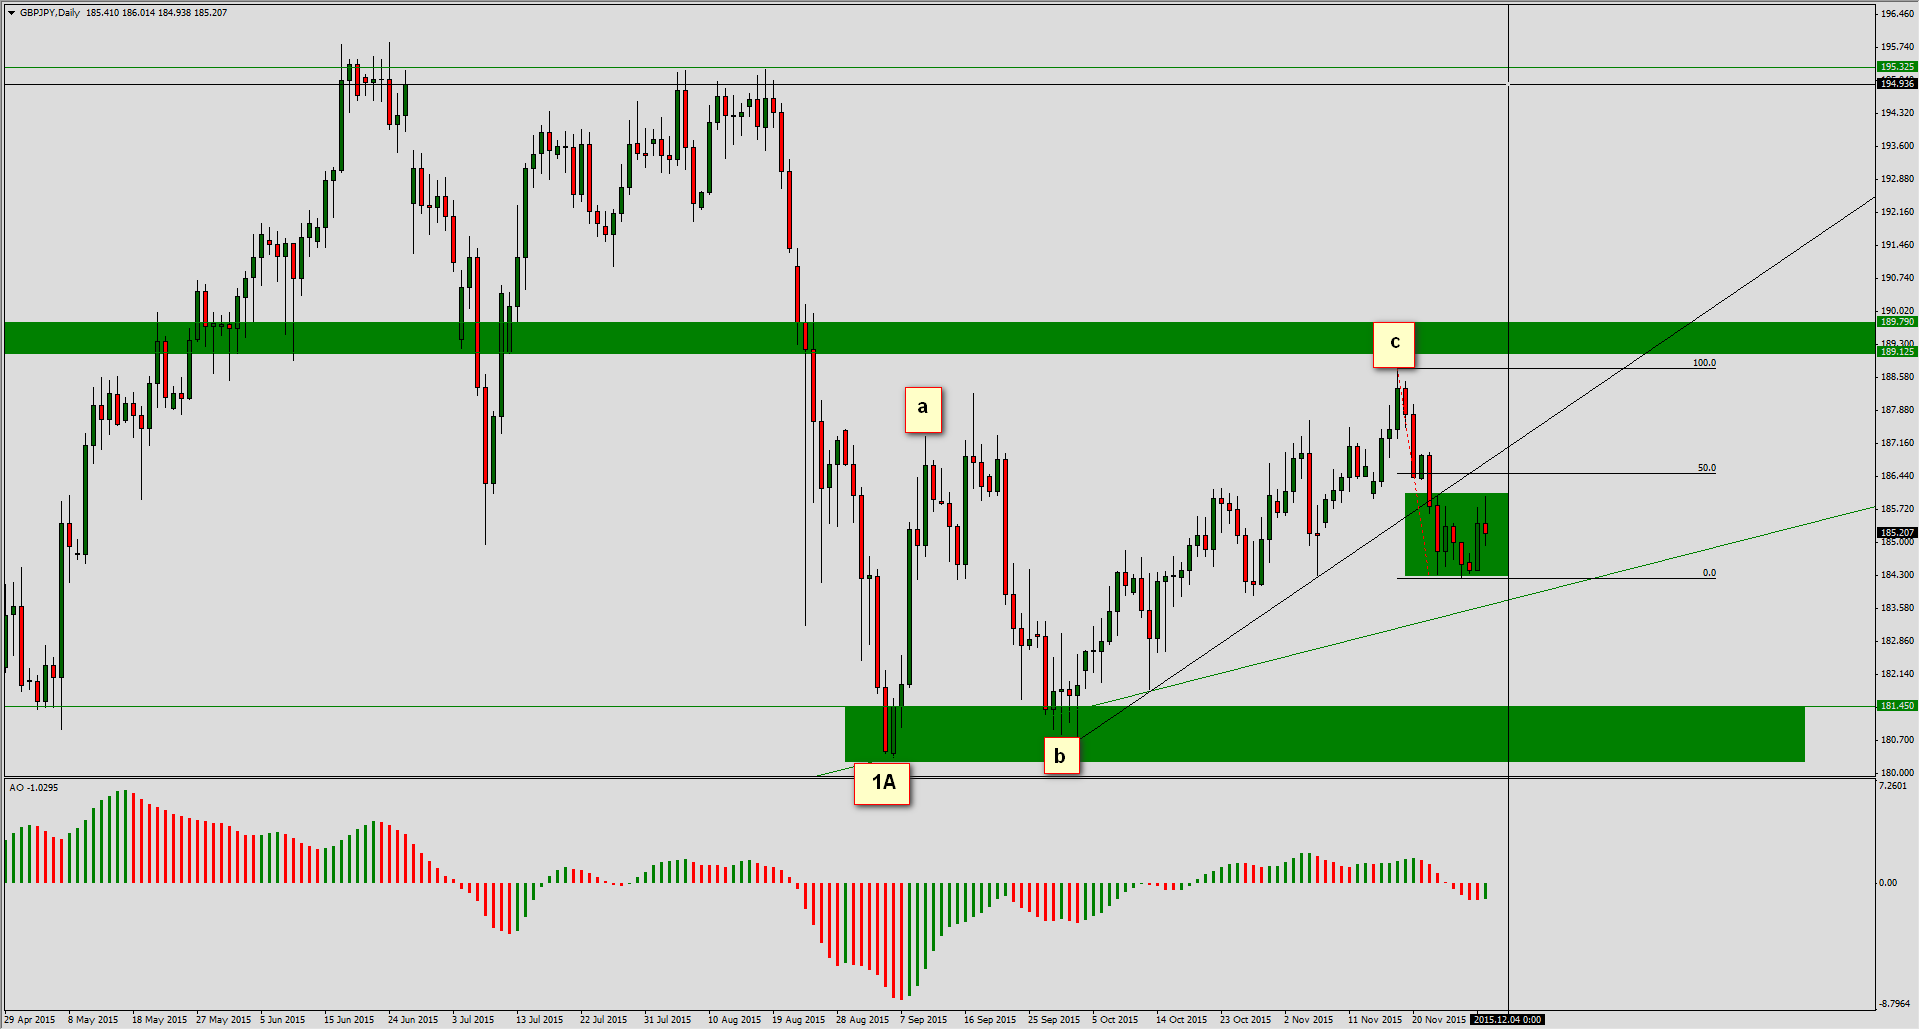
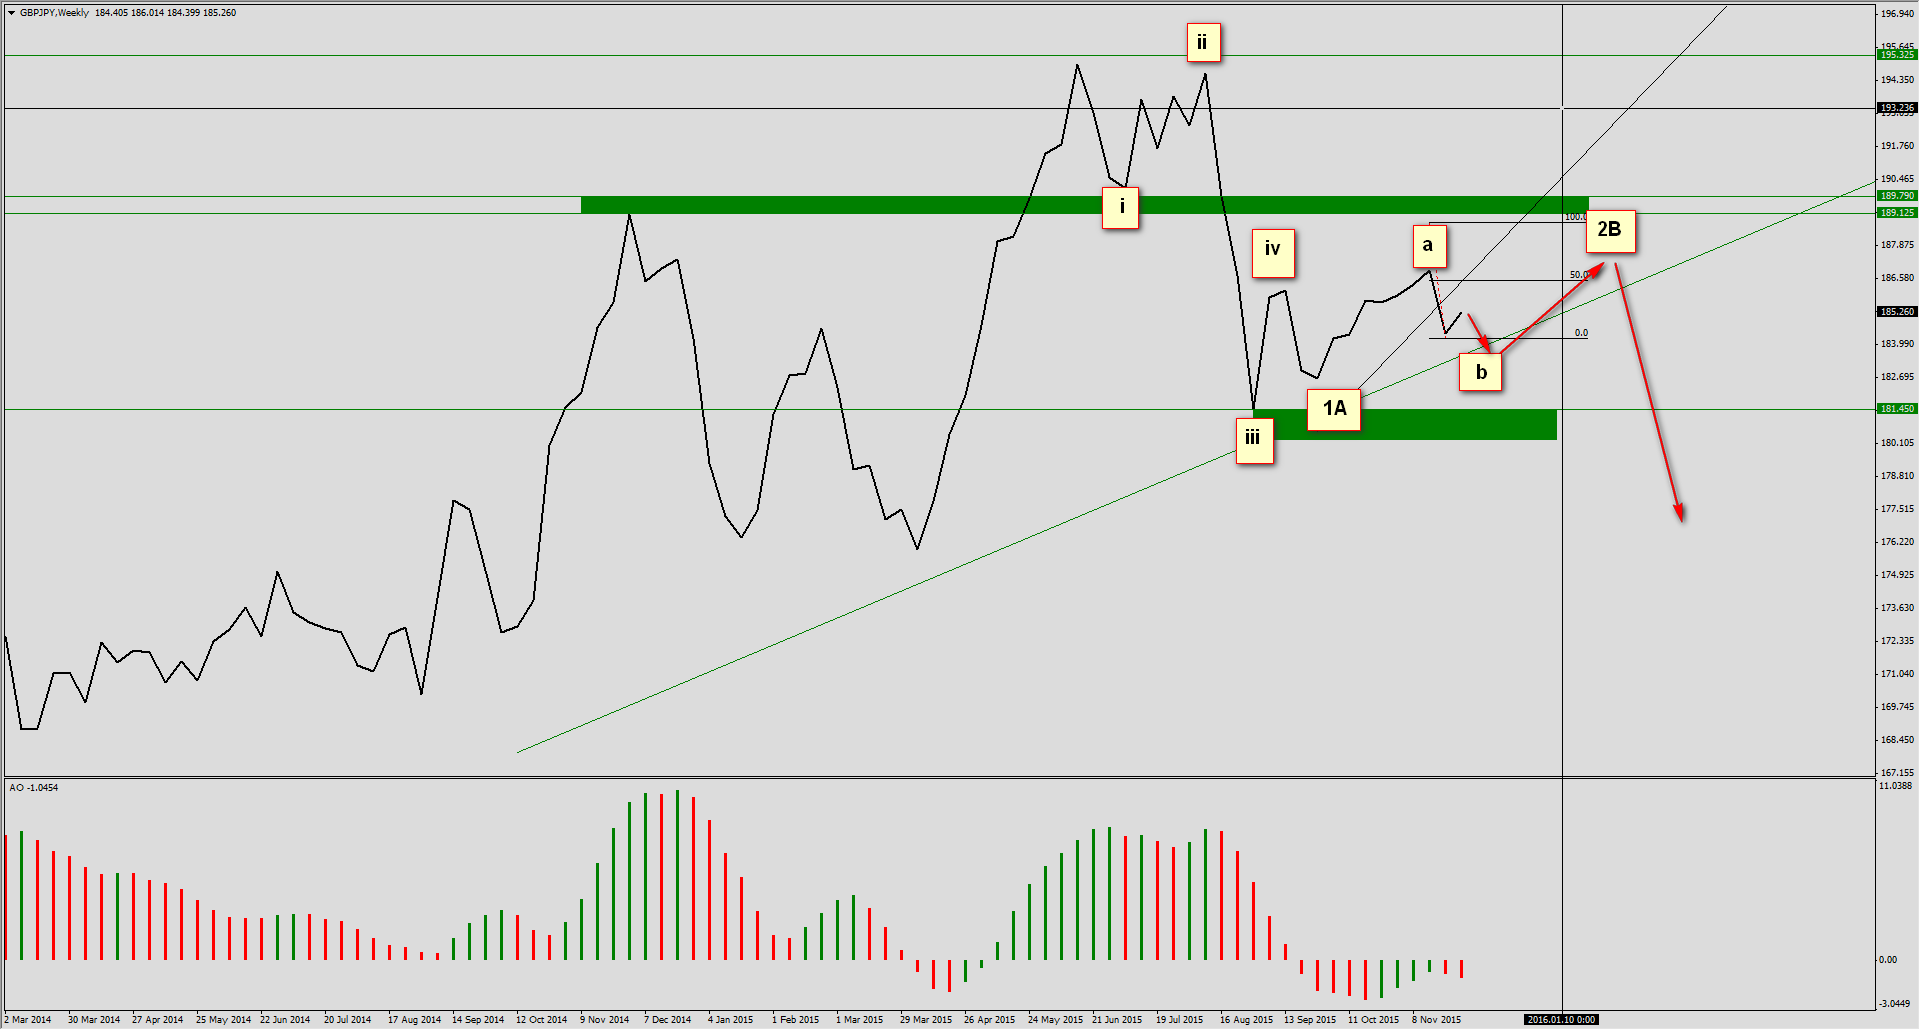
If we consider that the move from August 2015 is a first downward 1A wave, then the last upward movement should be its correction. It looks like a simple abc correction (zigzag), inside which c wave ended after retracing 50% of the downward wave of higher grade.
From the c wave top we can observe a decline, which is an impulse wave – it may be seen more clearly at lower TF.
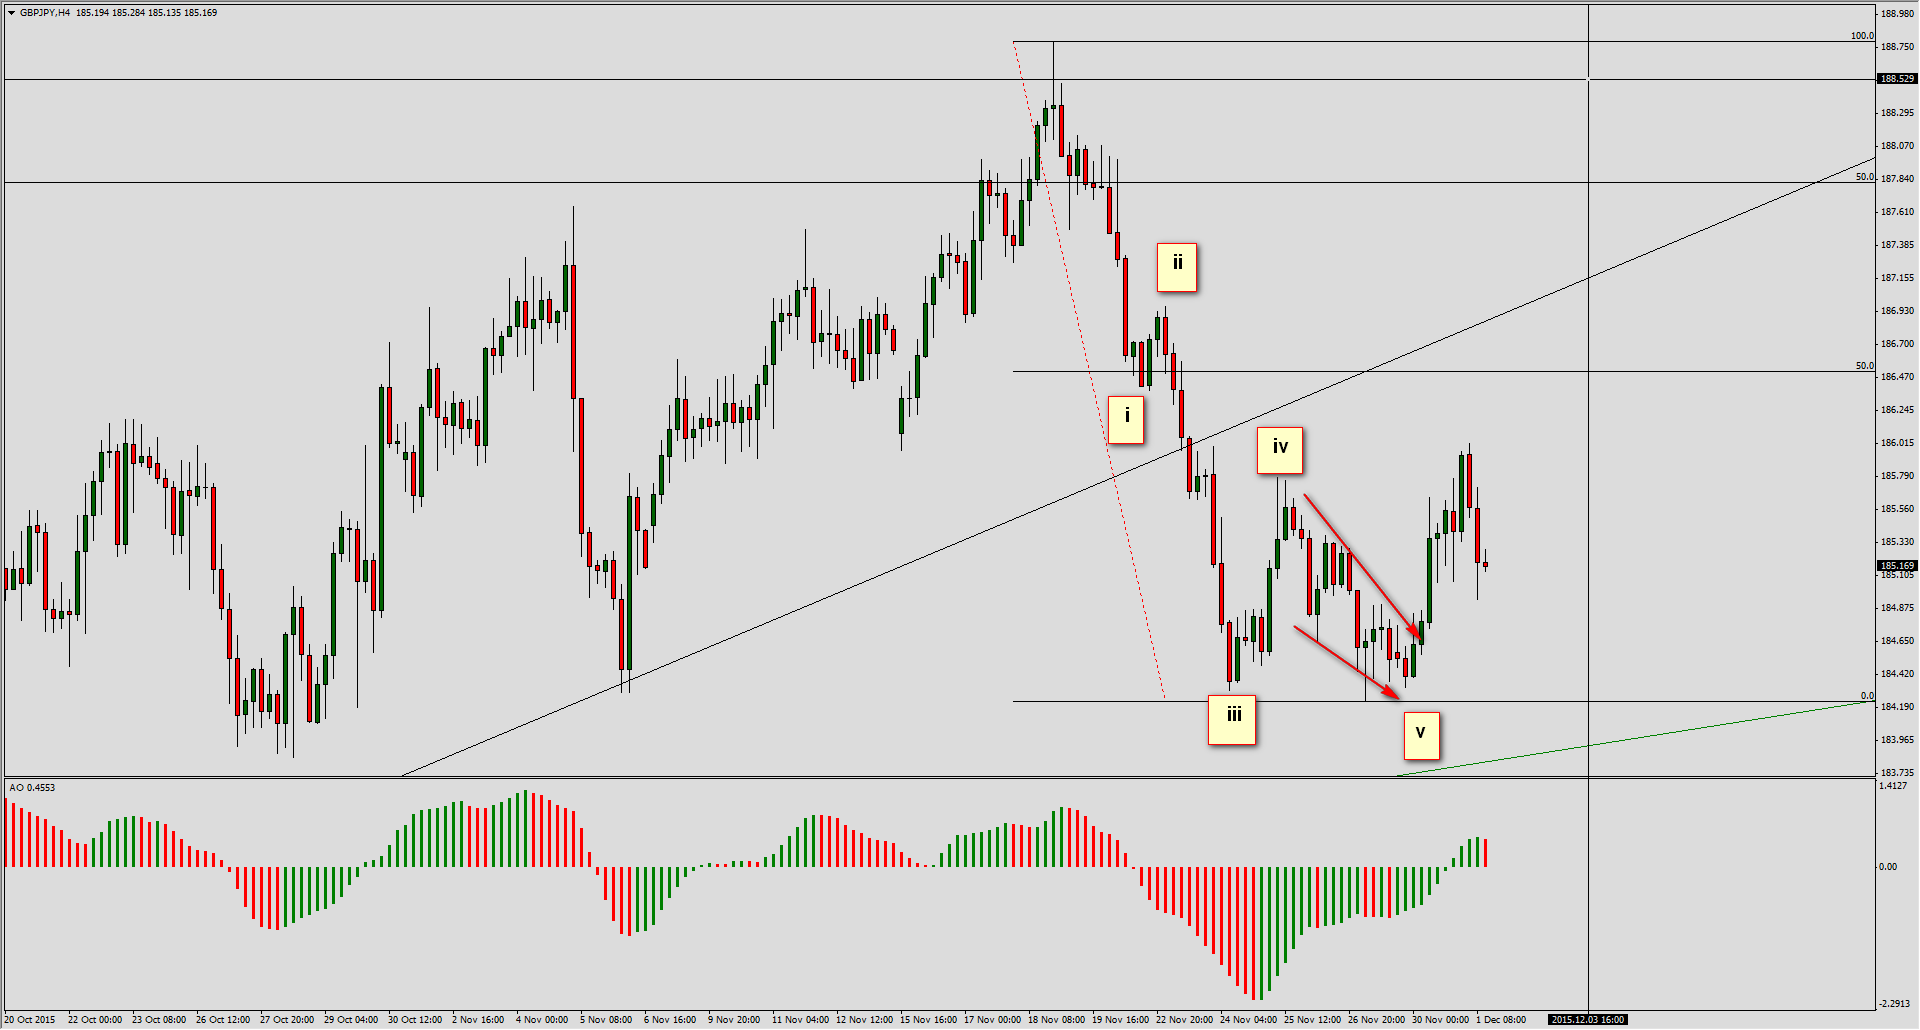
If all above assumptions are correct, then upward move from the late-September should be a correction of that decline. Changing to even smaller TF we will see that it is a five.
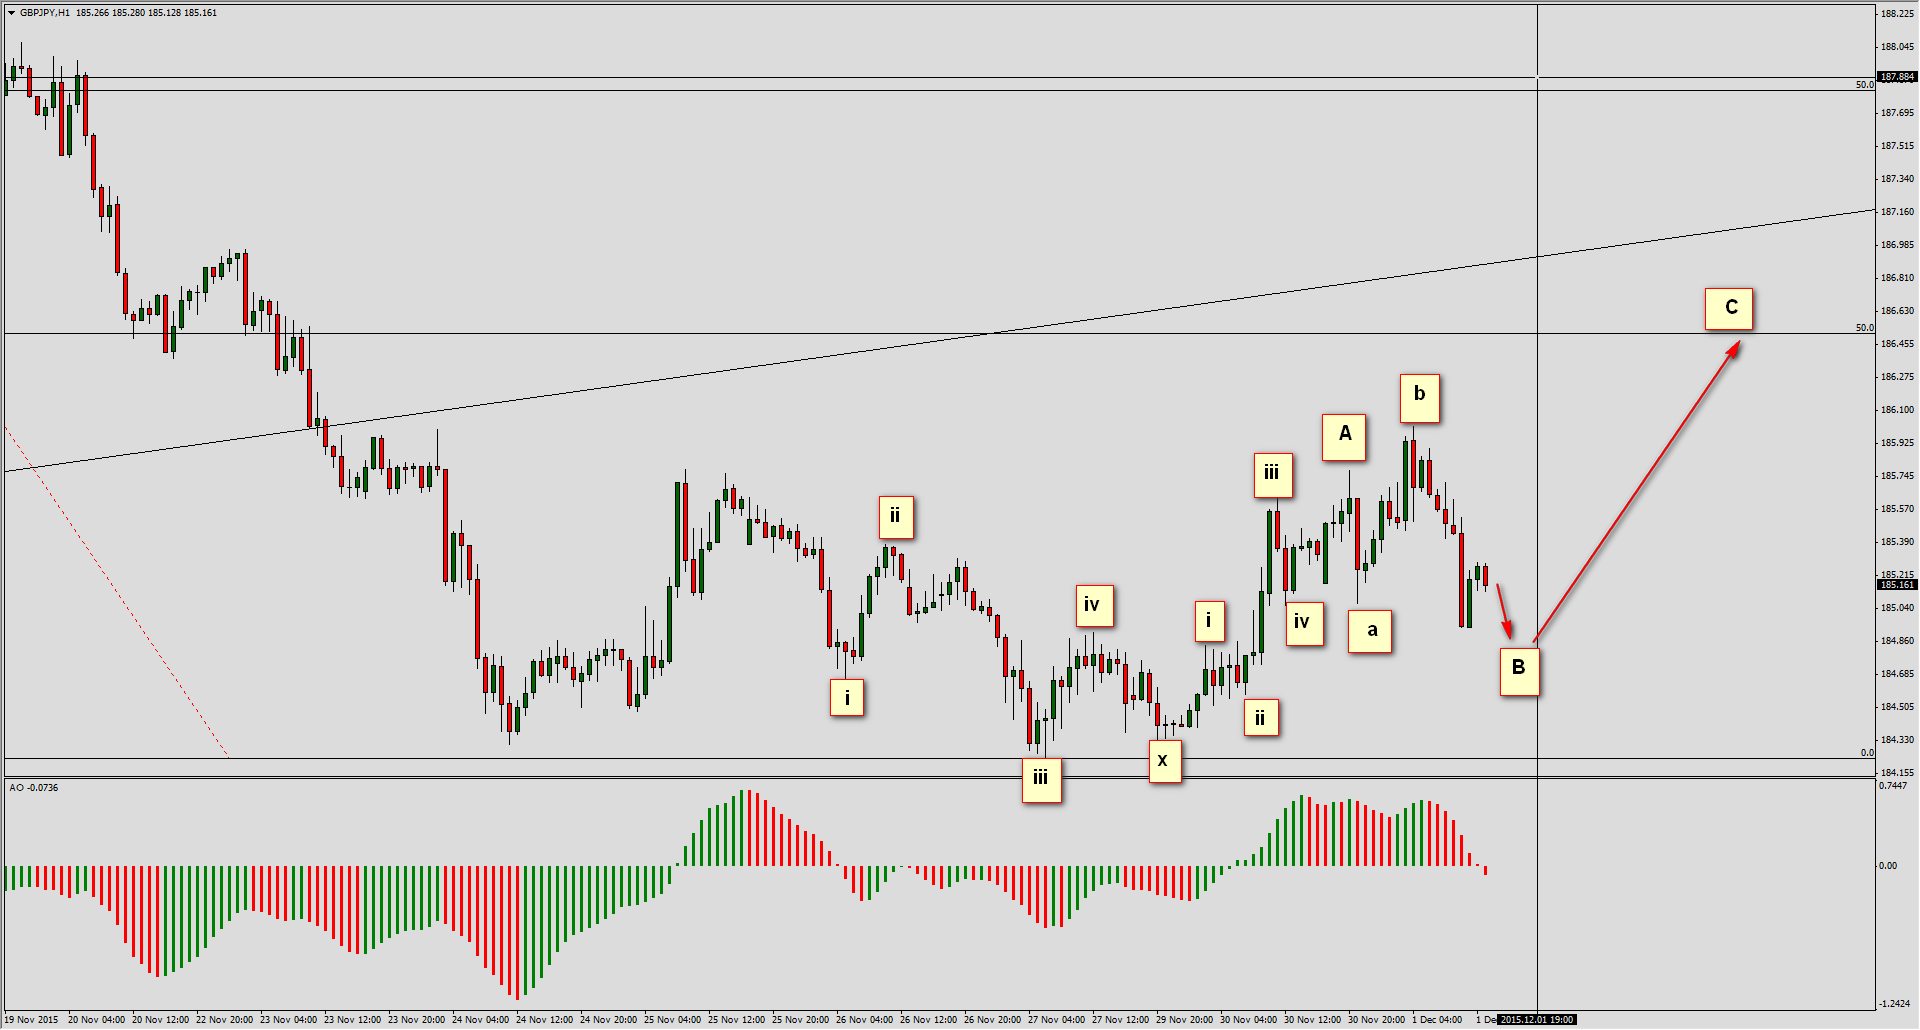
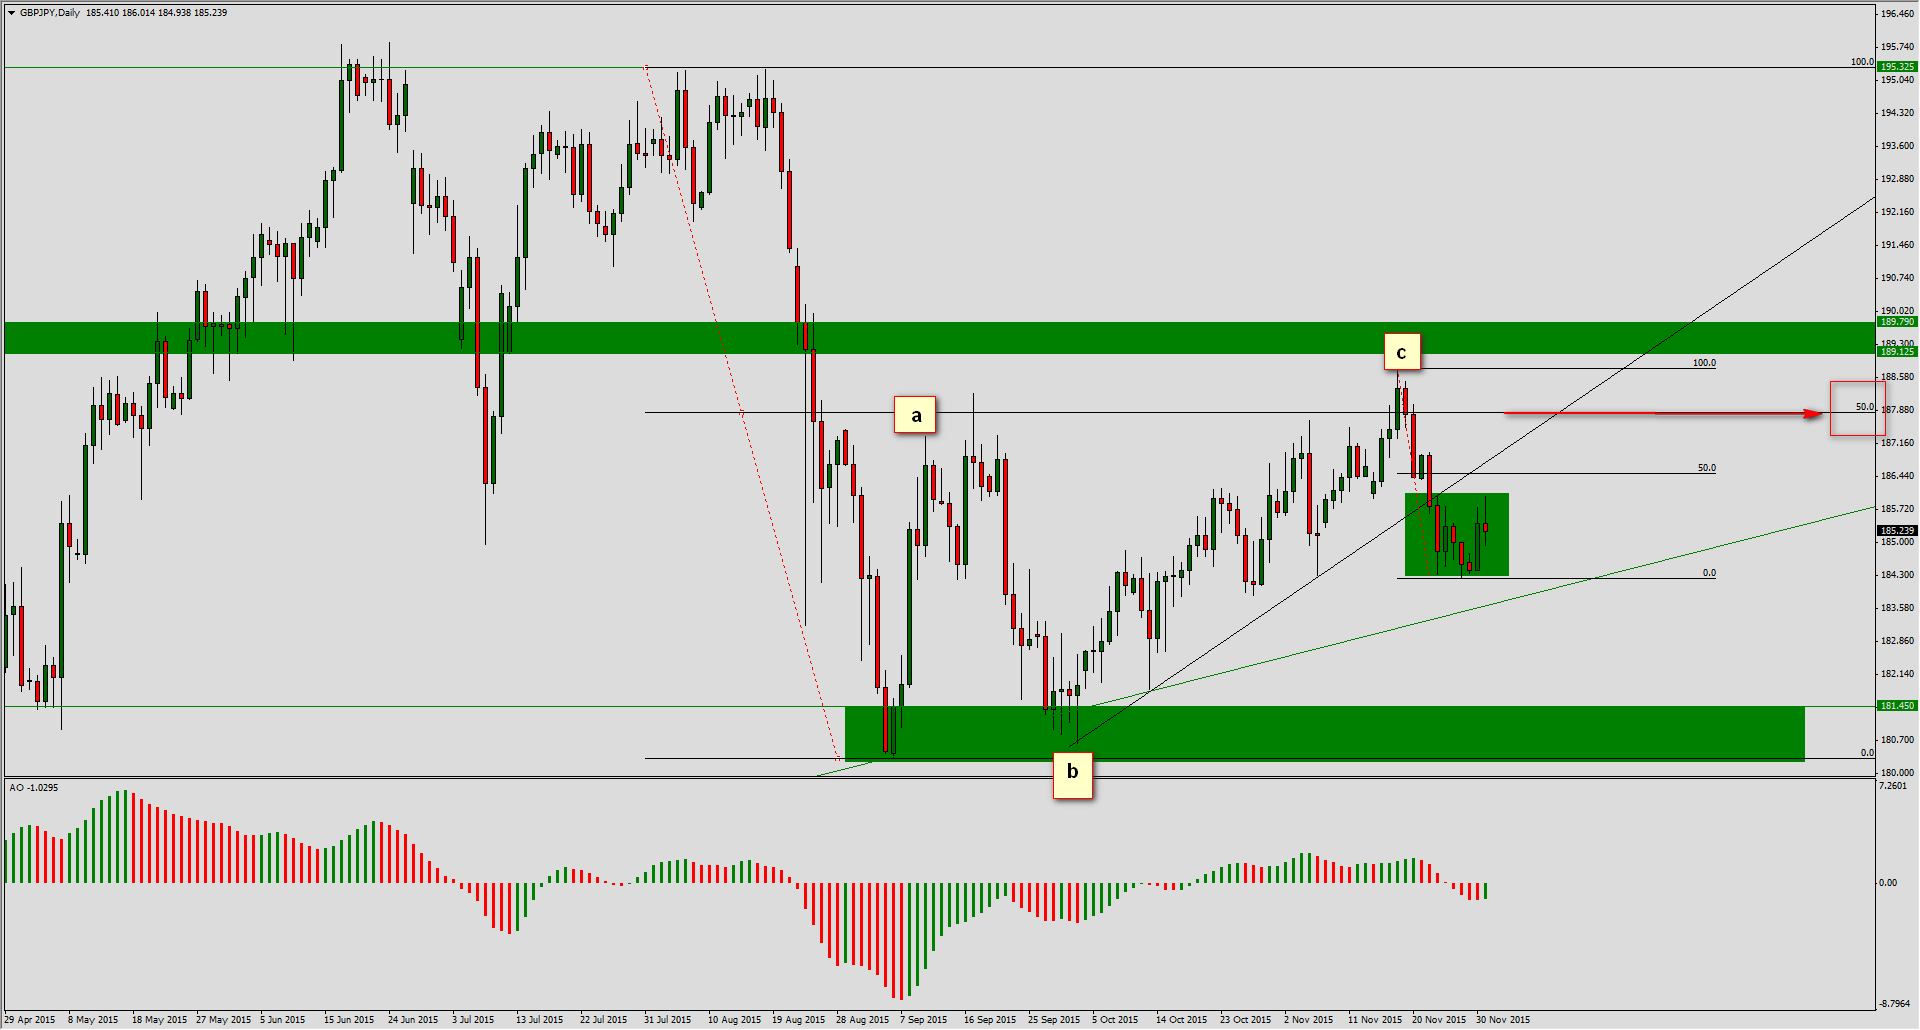
It means, that we need at least one upward move (after ending c wave in the irregular correction – assumption) and it ought to reach 50% or 61,8% retracement of the downward wave. We will be able to look for short opportunities there.
Such scenario is the most likely one, of course there is also an alternative scenario.
If we take a look at the weekly chart, we will see that the move from the bottom to the top can be seen as a five, but a different one than described above.
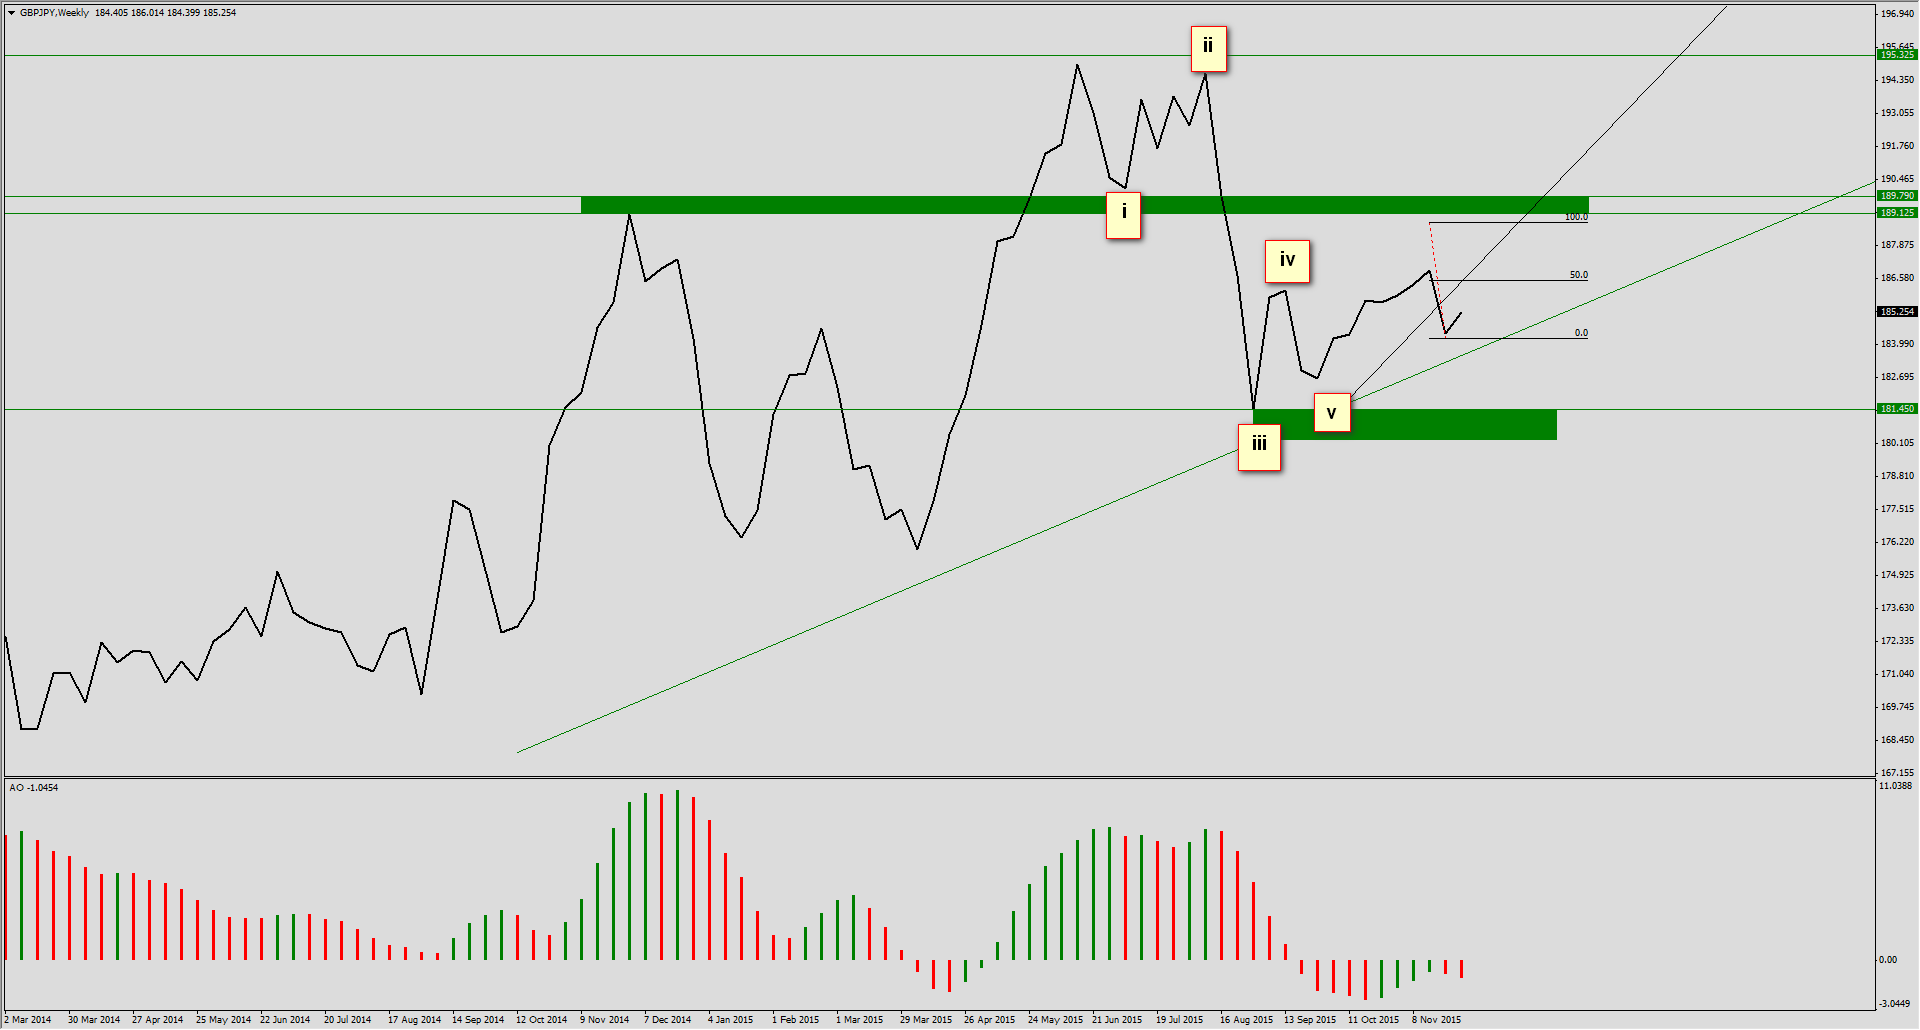
We can see an impulse here, where the fifth wave broke. It means that the last weak increase is just a-wave and now we will see the c-wave.
How to trade such scenario? Before opening the short position we have to see price reaction to the 50%-61,8% retracement of the downward wave. If such reaction shows and the move down forms, we will observe the main trend line (green). After stronger signal we will look for long opportunities counting on alternative scenario.
In this case it is possible to kill two birds with one stone.


 Review")


