Monthly S&P500 Emini futures candlestick chart: Middle of trading range
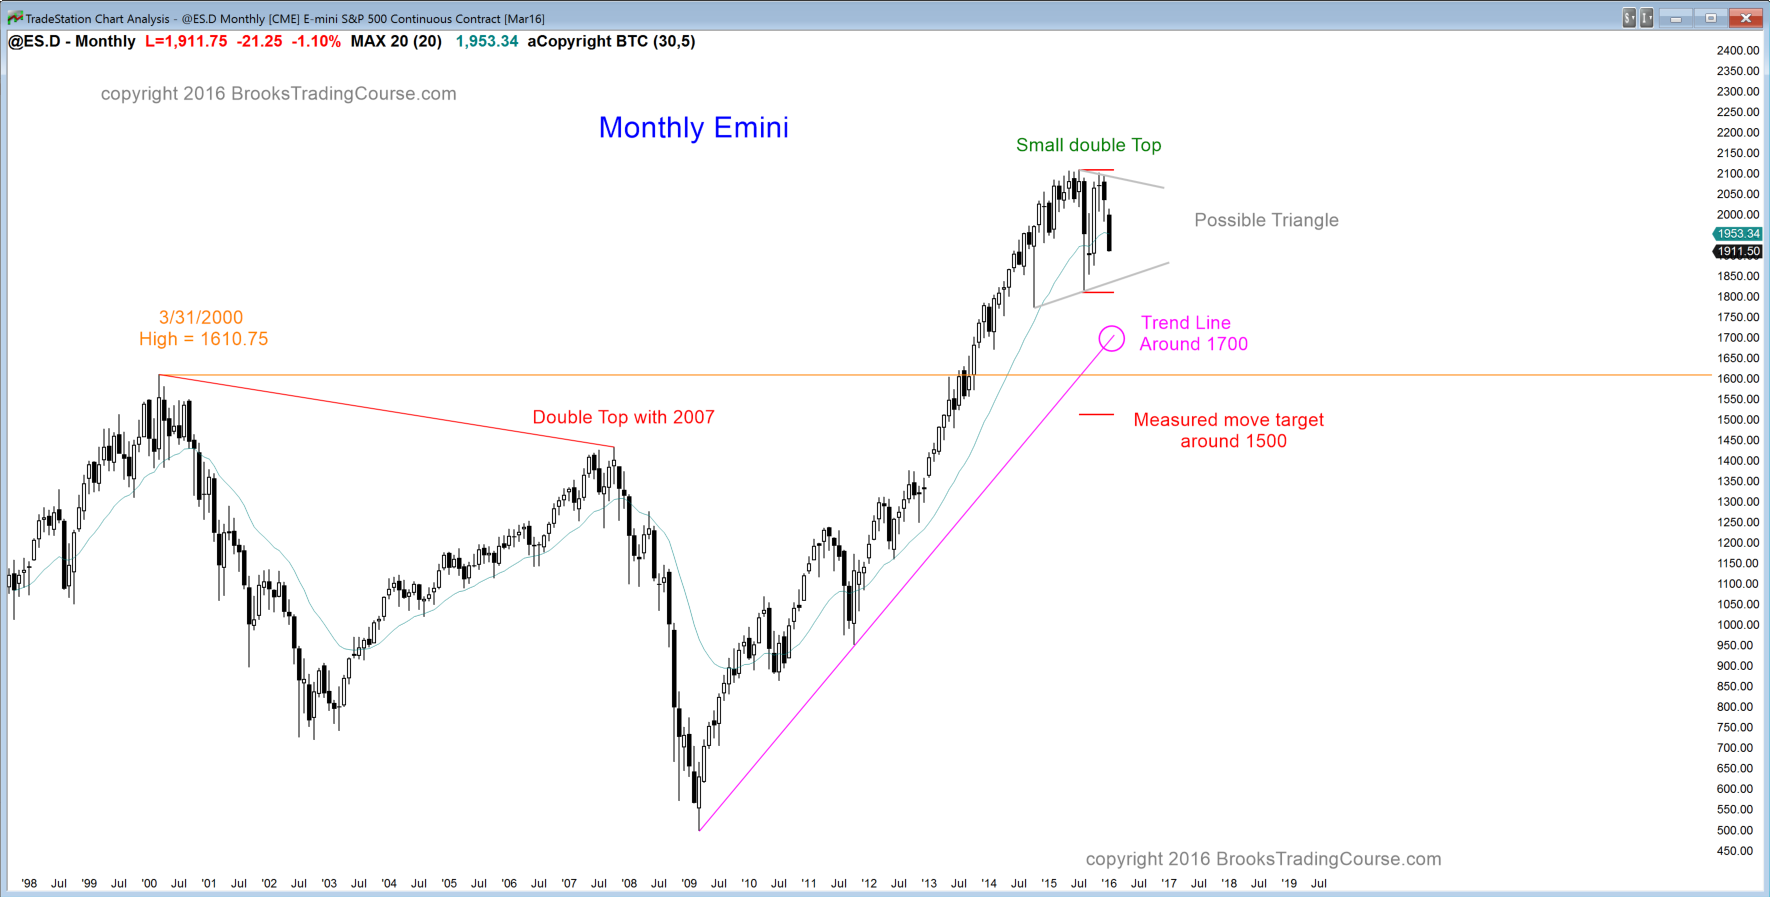
The monthly S&P500 Emini futures candlestick chart has a bear trend bar for its candlestick pattern, but it is early in the month. Traders who are learning how to trade the markets need to realize that it could look very different when the month closes. As bearish as the daily chart is, the monthly chart is still sideways after a 6 year bull trend. If it turns up from above the August low, that would create a 3rd reversal up in a trading range. Those who trade the markets for a living would call the candlestick pattern a triangle. The monthly chart would then be in breakout mode, which means that the trading range had enough bars so that the probability of a bear breakout has become as high as for a bull breakout (50%).
I have mentioned many times since last January that if a trader was looking to buy and hold stocks for several years, he should wait because the best the bulls were likely to get in 2015 was a trading range, and there was a 60% chance of a 20% correction. Nothing has changed. Although the Emini is still sideways on the monthly chart, the trading range is following an extreme buy climax. The S&P cash index has gone for 38 months without touching its 20 month moving average only twice in 50 years. In 1987, it was followed by a 36% crash, and in 1998, it was followed by a 22% correction.
The sample size is small, but the point remains that when there is an unusually strong buy climax, the bulls typically do not want to buy again for many bars and until the market falls many points lower. I use TBTL (Ten Bars, Two Legs) as a guide of a reasonable pullback in an average trend. Since this bull trend is so overdone, the odds of more bars and more points down are greater. No one knows if this will reach the downside targets on the chart, but if it does, bulls will then begin to buy.
Support in a swing down is always a magnet. It pulls the market down for a test. Bulls and bears want to know what will happen at support (or resistance). Will there be a huge number of bull dollars sitting there, waiting to buy cheap? Or, will there be a huge number of bear dollars waiting for the market to reach support, and then they sell, hoping to trap bottom picking bulls? They want to force the bulls to sell out of losing longs much lower. If both bulls and bears sell, the market goes down.
An obvious target after a breakout below a trading range is a measured move down that is based on the height of the range. That projection is around 1500. A 20% correction is well above that, at 1687.50, and that may be all that we see, like in 1998. Traders tend to think in terms of round numbers so there will be profit-taking bears and value-oriented bulls buying there.
There is also a bull trend line around 1700. Since the space between the 1st 2 points is somewhat less than the space between that 2nd point from October 2011 and the current possible 3rd point, fewer computers will use it in their algorithms. It is a less reliable support level. However, it is clear enough so that many computers will use it. When the market falls to a monthly bull trend line, there are always buyers, and there are often enough buyers to create a major rally. This happened at the monthly trend line in 1987 and in 2009.
The Emini never tested the breakout points at the 2000 and 2007 double top, which are about 100 points below the trend line. There is about a 30% chance that it will be tested on this selloff.
Since the monthly chart is still in the middle of a 2 year trading range and just below the moving average, can investors buy here and put a stop below the October 2014 low? The math actually is reasonable, but the momentum down this month is strong enough to make it likely that the monthly chart will test closer to the bottom of the trading range.
When the market is in a trading range, traders like to buy in the lower half and sell in the upper half. The momentum down makes traders erroneously believe that the bears have a very high probability of a successful bear breakout, but they do not. Also, buying near the bottom and putting a stop a modest distance below the bottom means that the risk is less than the reward. The bulls are looking for a test of the top half of the range. When the probability of profit is about the same as the probability of the stop being hit, and the reward is greater than the risk, the Trader’s Equation is positive (the trade makes mathematical sense). However, the math would be stronger if the selloff tests down lower and then reverses up strongly. Most bulls will wait to buy until they see that, like they did in August and October.
Weekly S&P500 Emini futures candlestick chart: Strong reversal down from a lower high
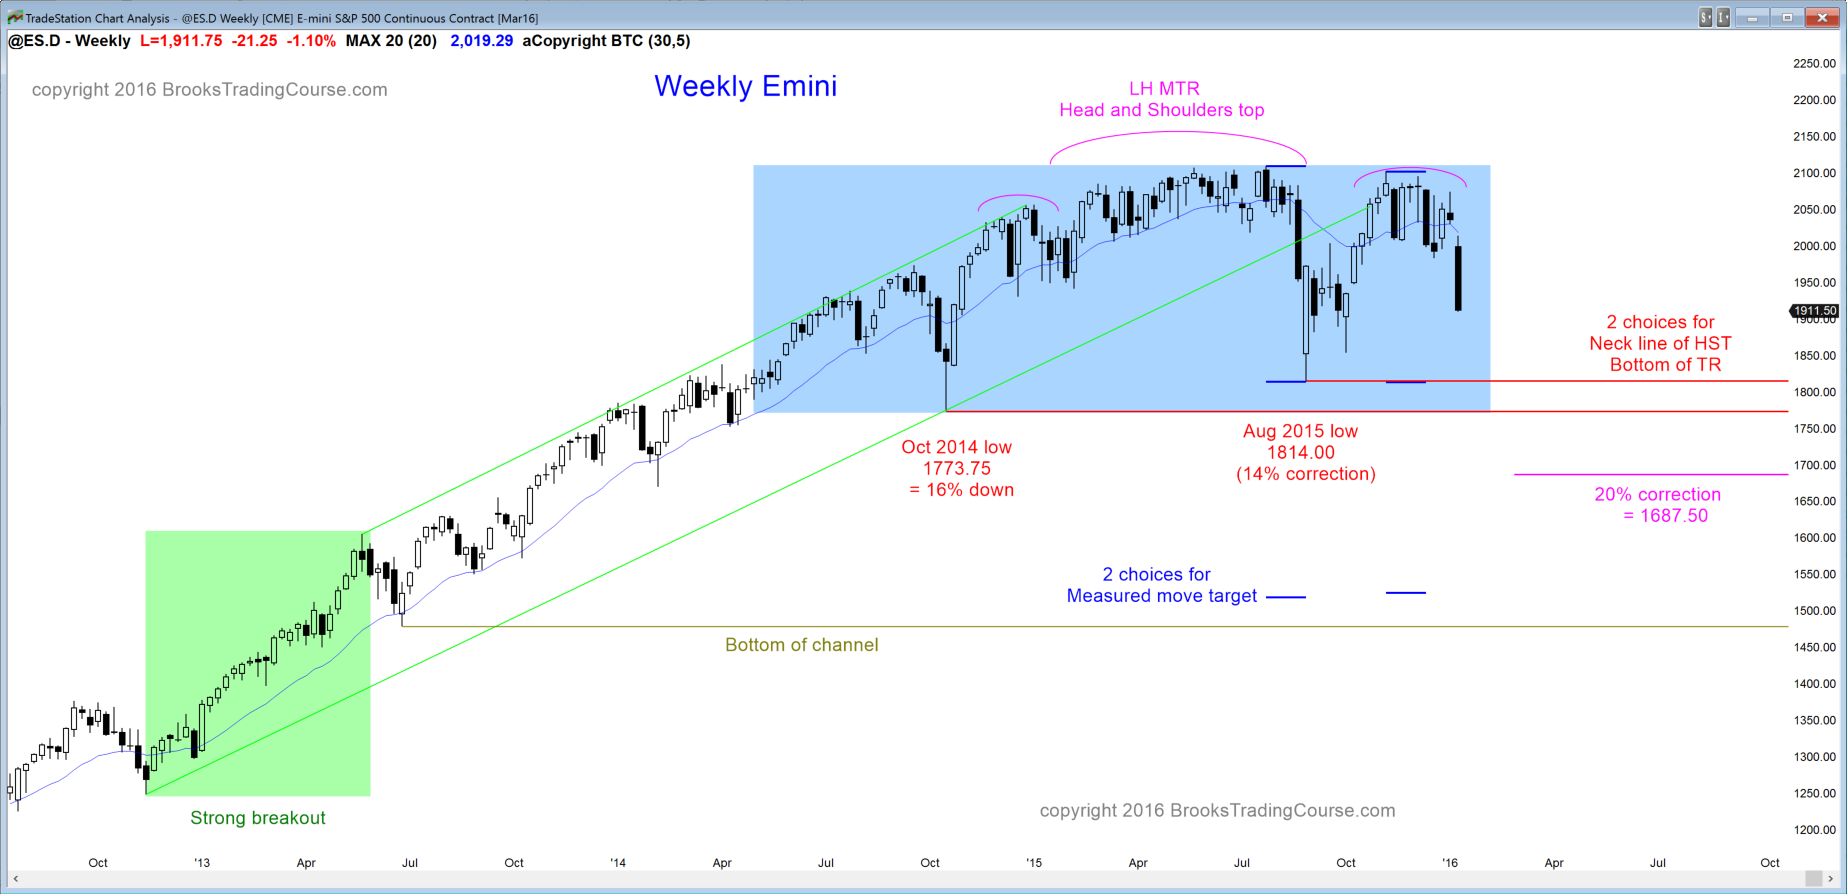
The weekly S&P500 Emini futures candlestick chart is now Always In Short. The 1st targets are the August 2015 low of 1814.00 and the October 2014 low of 1773.75, which would be a 16% correction. A 20% correction would be at 1687.50, which is below the double bottom. That double bottom is the neck line for a 2 year head and shoulders top. The measured move down is just above 1500.
There is a 60% chance of a test of the August low and a 40% chance of a 20% correction. The bulls will try to prevent this selloff from falling below the low. They would like this selloff to be simply a sell vacuum test of support, and they would prefer that the reversal up comes from a higher low. That would be evidence of strong bulls, and it would increase the chances of a breakout to a new all-time high before there is much more correction. They have about a 30% chance of a strong reversal up to a new all-time high before a test of the August low at the moment.
The bulls want the trading range to continue and then they hope for trend resumption up. Since most breakouts fail, this bear breakout attempt will probably fail as well. The reversal up might, however, only come after a break below the neck line. At the moment, there is probably about a 30% chance of the swing down reaching the measured move target based on the height of the trading range. That target is around 1500.
There were strong selloffs in October 2014 and August 2015. As strong as they were, they were followed by violent reversals up. The bulls who bought so aggressively at 1800 might do the same again this time. It is too early to know. If they do, that would be the 3rd reversal up from 1800, and traders will then see the 2 year trading range as a big triangle in a bull trend. The probability for the bears would drop back to 50%, and it would be the same as for the bulls. The weekly chart would be back in breakout mode.
Daily S&P500 Emini futures candlestick chart: Bear breakout below bull flag
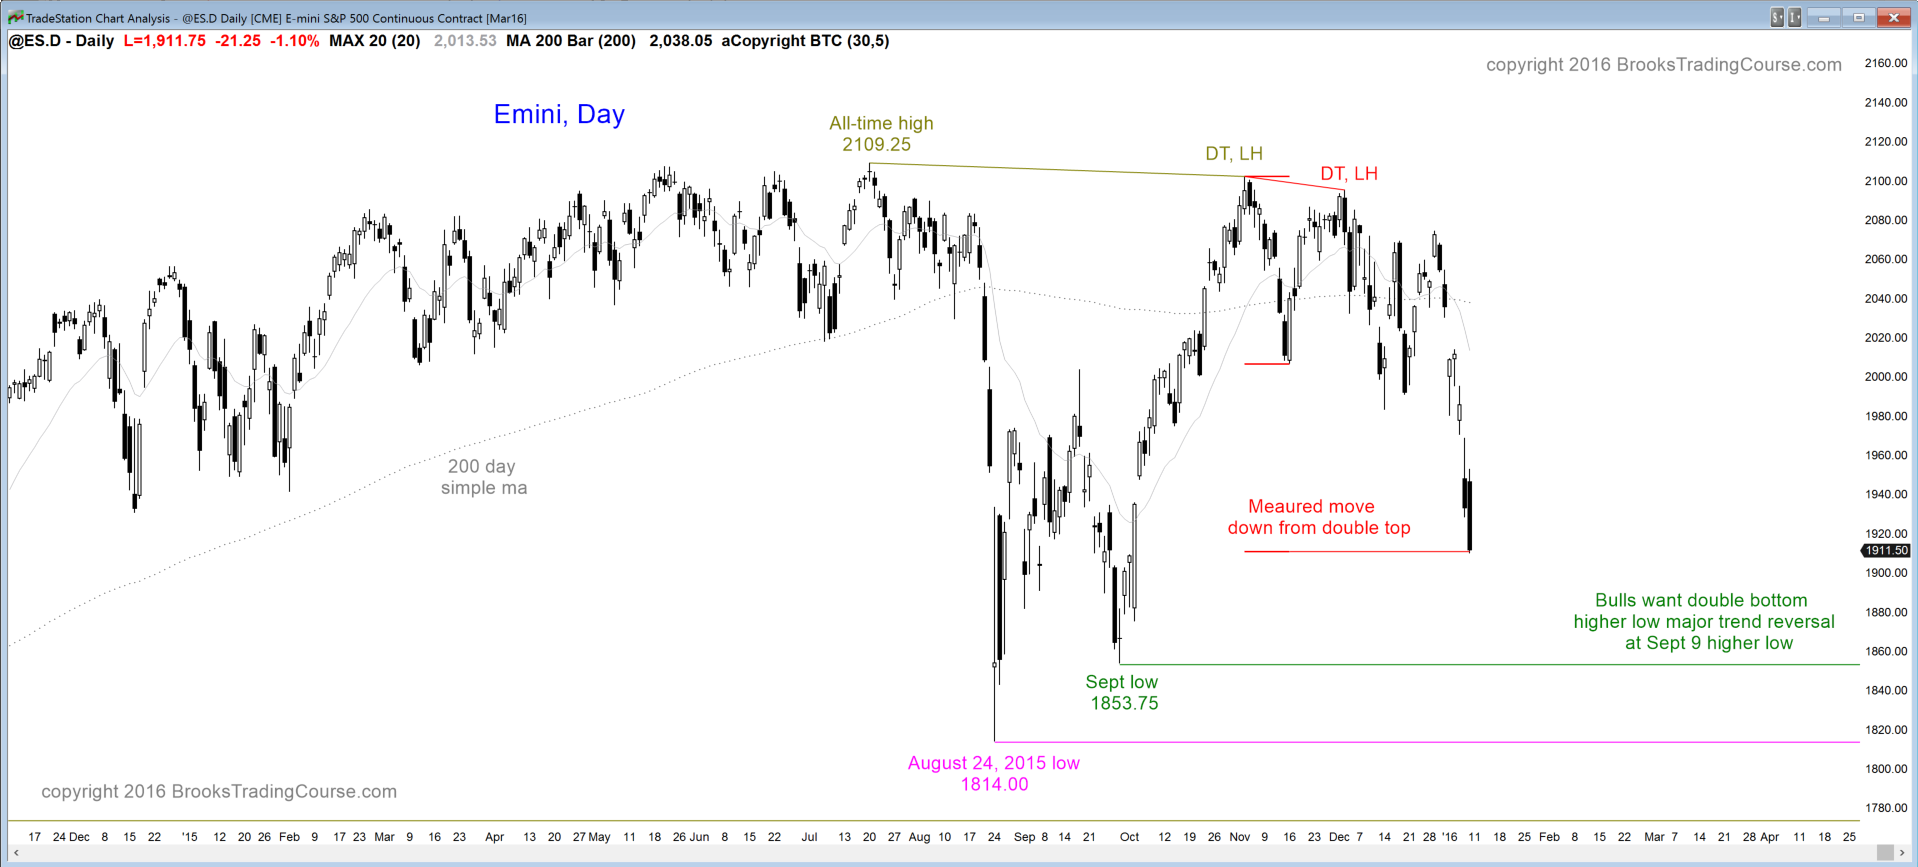
The daily S&P500 Emini futures candlestick chart turned up from a wedge bull flag on January 4, and then began a violent reversal down 2 days later. It is currently in a bear breakout below a bull flag. When a breakout is this big, there is at least a 60% chance that the first reversal up will be sold. Bears want to sell again higher. Bulls want a rally so that they can sell out of their losing longs with a smaller loss. The result is a test back down or even a bear trend.
Friday closed at a measured move down based on the daily chart. There is a 60% chance of a test of the September low in the next could of weeks. The bulls will buy there and hope to form a double bottom with that low. That would then create a double bottom higher low major trend reversal from the August bear trend. The bears know how important this support is for the bulls, and they want to break strongly below it and below the August low. That August low is the neck line of the July – October double top. The bears would then hope for a measured move down of about 300 points, which is the height of the double top.
Since 60% of tops fail, this one will probably fail to fall far below the August low. However, the momentum down is strong, there are sellers above, and there is room to support. There is at least a 60% chance of at least a little more down, whether or not there is a rally 1st. If there is a rally, the 1st target for the bulls is the breakout point at the bottom of the wedge bull flag. That is the January 4 low or even the November 16 low. A 50% pullback is also around 2000.
The 2nd leg down from this selloff might be brief. For example, if Monday is an inside bar with a bull body, bears will be disappointed and many will buy back their shorts below the low of that bar. There could be a 2nd leg down that lasts only one bar. A reversal up would then form a micro double bottom, and it could test the 2000 area before bears would be willing to sell again.
The important point here is that this selloff has not yet fallen below the August low, and traders need to realize that it might not. If it begins to reverse up strongly, traders will buy, even though they know the odds as of today favor a 2nd leg down. A strong reversal up could quickly change those odds. Because the selling of the past 7 days has been so extreme, it is climactic. Bears will take some of their windfall profits and bull scalpers might begin to buy below bars. This means that there is at least a 50% chance of a 1 – 3 day pullback next week.
See the weekly update for a discussion of the price action on the weekly candlestick chart and for what to expect going into next week.


 Review")


