Monthly S&P500 Emini futures candlestick chart: Bull flag at the moving average
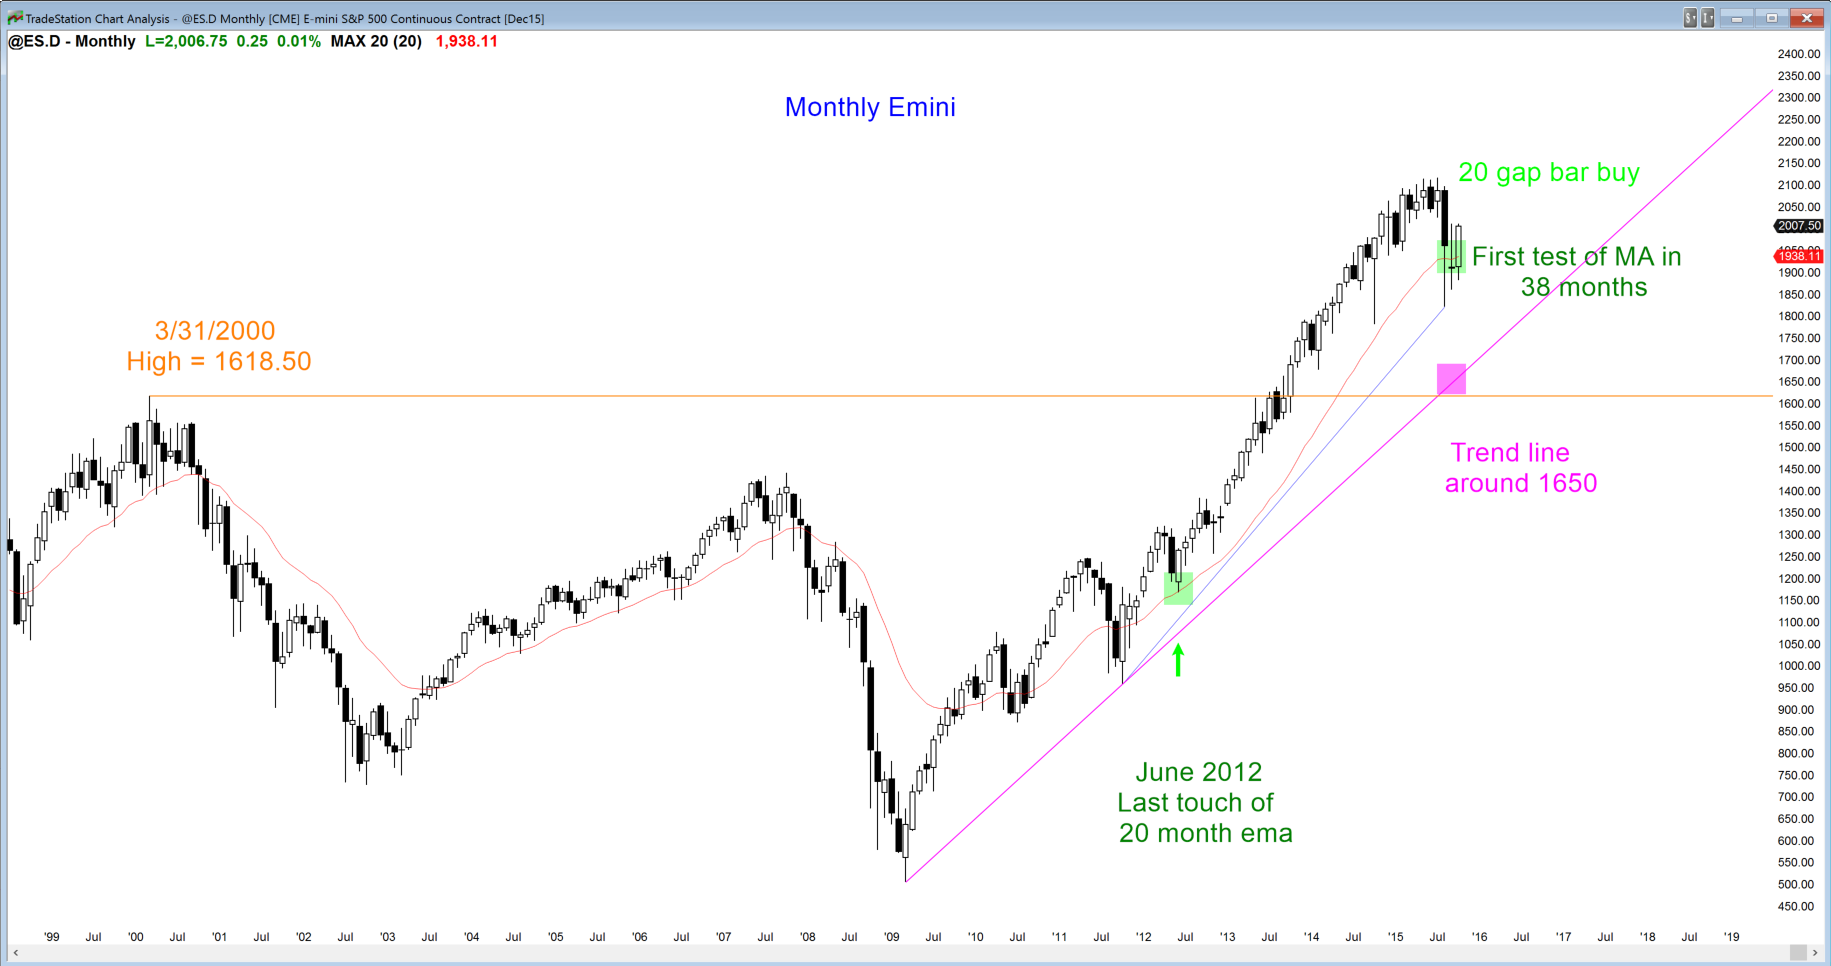
The monthly S&P500 Emini futures candlestick chart has tried to break below the moving average during each of the 3 past months and continues to fail. September formed a bull inside bar and a buy signal bar. Since it is a big doji, the odds are that there are sellers above, and a breakout above last month’s high will probably not go far. Instead, a trading range is likely to begin to form.
Weekly S&P500 Emini futures candlestick chart: Double bottom with August low and with last October’s low
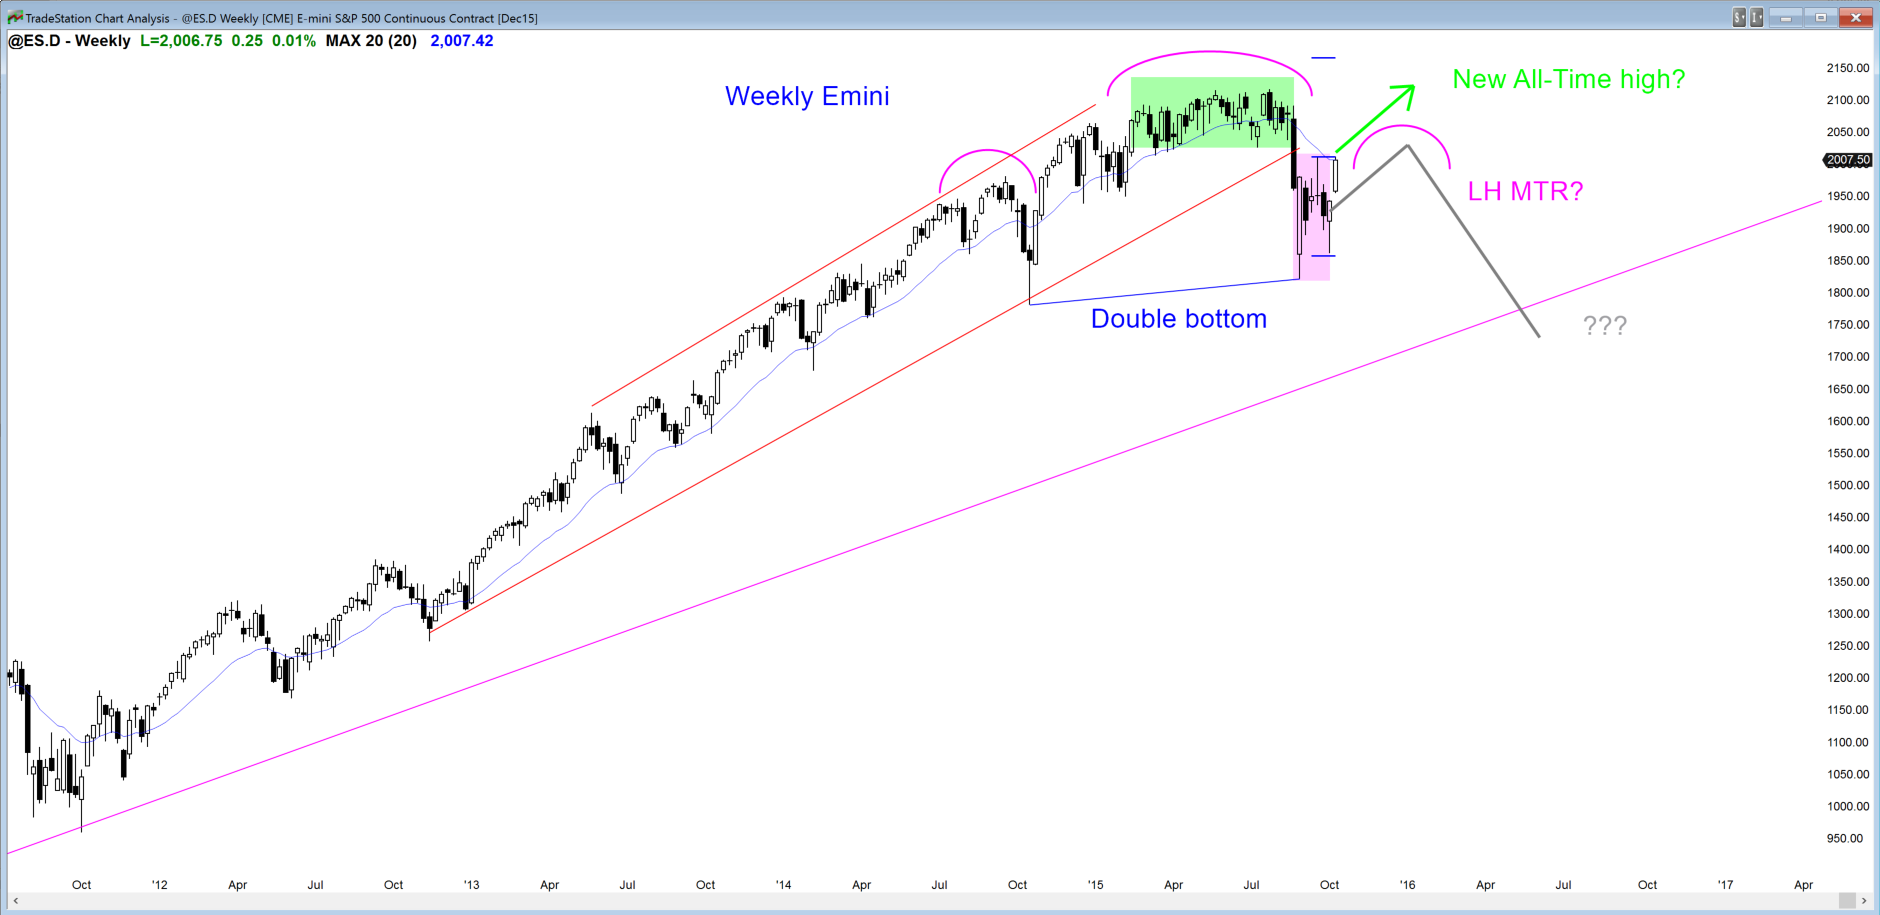
The weekly S&P500 Emini futures candlestick chart had a good week for the bulls. The bulls want a strong follow-through bar next week, with a close far above the September high and the moving average. Whether or not they get what they want, the reversal up over the past 2 weeks has been strong enough so that bulls will probably buy the first reversal down. This means that the best that the bears can reasonably hope to see over the next couple of weeks is a pullback, maybe to test the gap below this week’s low.
Last week’s low formed a double bottom with the August low, and the September high is the neckline of the double bottom. The bulls want a strong breakout above then neckline. A measured move up would test the all-time high.
The August low formed a double bottom with last October’s low and the neckline is the all-time high. A measured move up, if the bulls were able to get it, would be several hundred points higher. It is more likely that the rally would stall in the 7 month trading range that ended in August. After many months, the market would decide between the bull breakout and a big double top.
The bears want this week’s rally to form a double top bear flag at the moving average with the September high. They hope this rally is simply a buy vacuum test of the resistance of September high. They then want a reversal down, which would form a double top bear flag with the September high.
The bears want a strong reversal down next week, hoping to create a double top bear flag with the September high, but they know this will probably not happen after 2 strong weeks up. Alternatively, they might be able to halt the buying and create a small trading range. They then would try to make a a micro double top within the tight trading range, which could lead to a test down to the gap below this week’s low, and possibly even a bear breakout below the August low.
Daily S&P500 Emini futures candlestick chart: Learn how to trade the markets at the top of the trading range
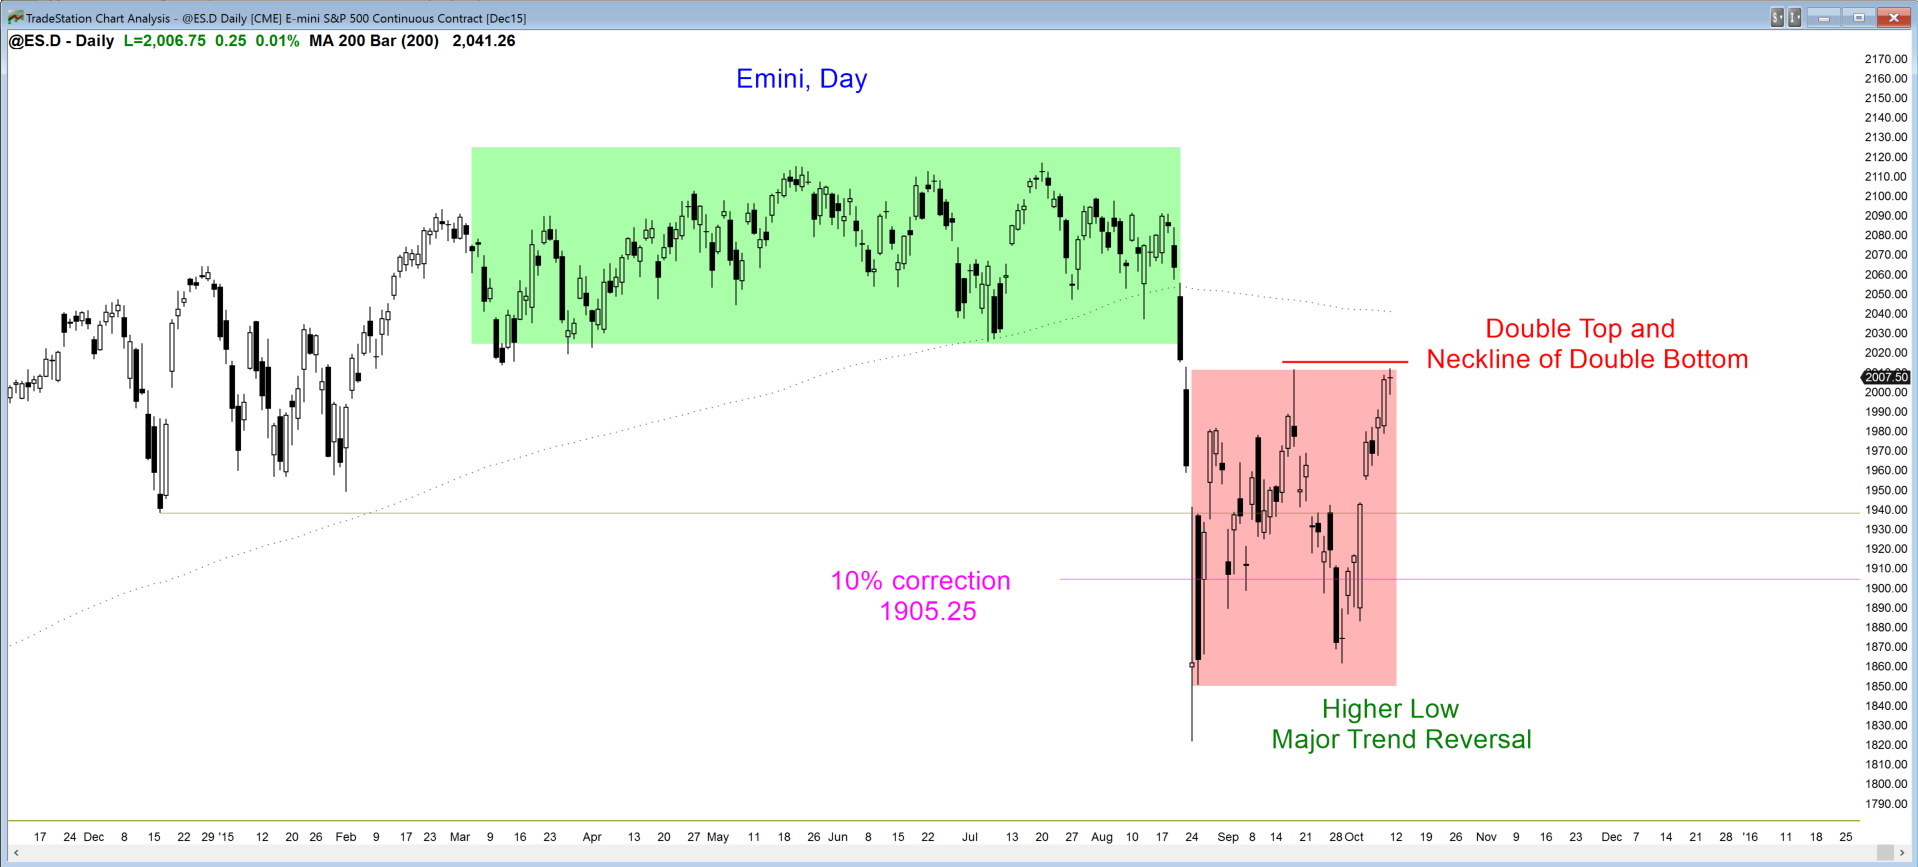
Before this week, the daily S&P500 Emini futures candlestick chart had a 60% chance of any rally being a bull leg in a 2 month long bear flag, which would soon be followed by a 2nd leg down. The rally has been strong enough so that those who trade the markets for a living now believe that the odd of a test of the all-time high have risen to 50%. The bulls need a strong breakout above the top of the trading range. While they prefer that the breakout comes next week, they are confident that if the Emini begins to turn down from the double top with the September high, the bulls will be strong enough to rally back up for another attempt at the breakout.
Because the rally has not yet broken above the top of the trading range, and even strong legs up in trading ranges usually lead to reversals, there is at least a 50% chance of a pullback over the next couple of weeks. This is true even if the bulls break above the September high first.
The 200 day moving average is around 2040, and that will likely be resistance. The rally will probably pull back either from where it is now at the September high or from the 2040 area. If the Emini reaches the 200 day moving average, the bears will see a reversal down from there as an expanding triangle bear flagwith the August 28 and September 17 highs. The bears want the double top with the September high.
When a test of resistance comes from a rally as strong as this one has been, a reversal down usually requires at least a micro double top. This means that there will probably be buyers below today’s low and that a reversal down will probably only last for 1 – 3 days before the bulls again try to break above the September high. If they fail again, the micro double top might lead to a small measured move down, which might test the gap below this weeks low. The bears hope that it would continue down and break below the bottom of the 2 month trading range, but they need to create a lot of big bear bars to erase the bullishness of the past 2 weeks.
Original post was published at Al Brooks Price Action Trading Blog. Check Brooks Trading Course and get The most comprehensive source of information on price action trading available!


 Review")


