Monthly S&P500 Emini futures candlestick chart: Double top, and more trading range price action next week
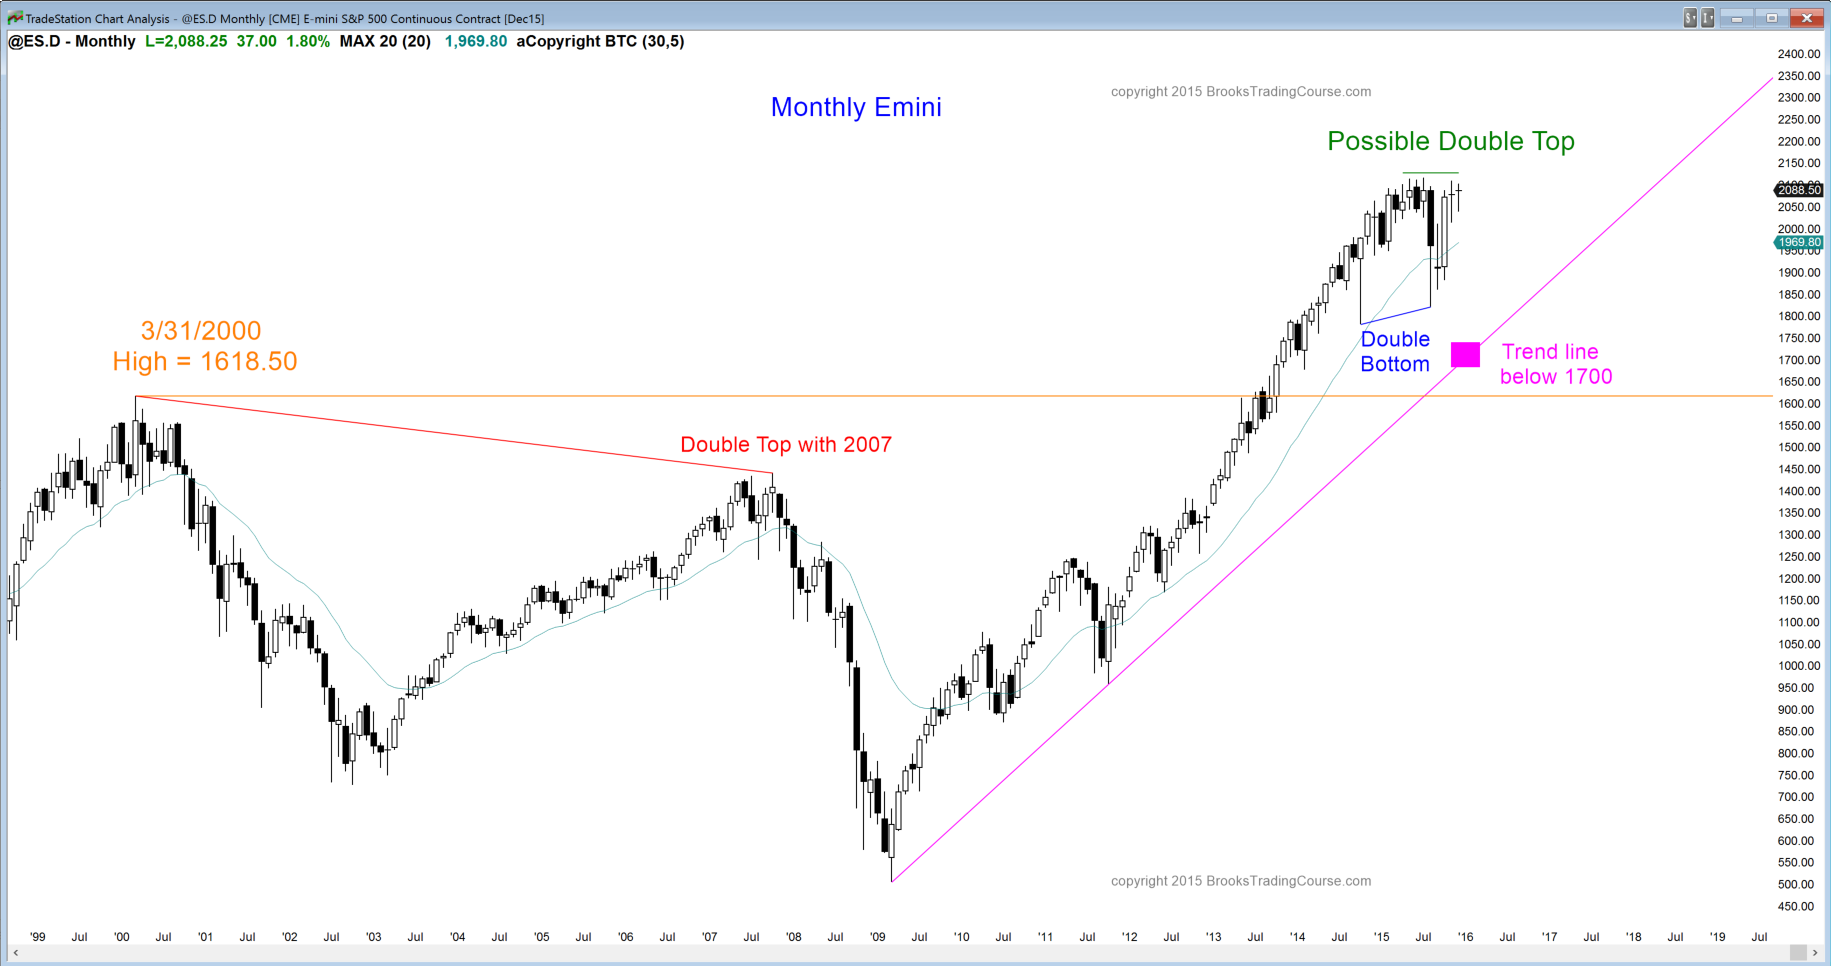
The monthly S&P500 Emini futures candlestick chart has only had 4 trading days this month so the monthly chart is unchanged from last weekend. More trading range price action next week is likely. The bears see a double top with the July all-time high. The bulls see October as a breakout of a small bull flag that pulled back to the moving average. The Emini was above the monthly moving average for 38 months. When the bulls are willing to buy above the average price for a long time, they are usually eager to buy when they get an opportunity to buy at the average price.
That is what happened in August. The monthly Emini was above the moving average for 38 months. The cash index has only done that twice in 50 years. In 1987, it was followed by a 36% selloff. In 1998, it was followed by a 22% selloff. While being above the moving average for a long time is a sign of strength, if it stays above for too long, it is unsustainable behavior and therefore a buy climax. When a market has a buy climax, it usually has to go sideways to down for about TBTL Ten Bars Two Legs before the bulls will be willing to buy again. Ten bars on the monthly chart is about a year. The Emini might continue mostly sideways for a year.
Weekly S&P500 Emini futures candlestick chart: 2nd entry sell for lower high major trend reversal
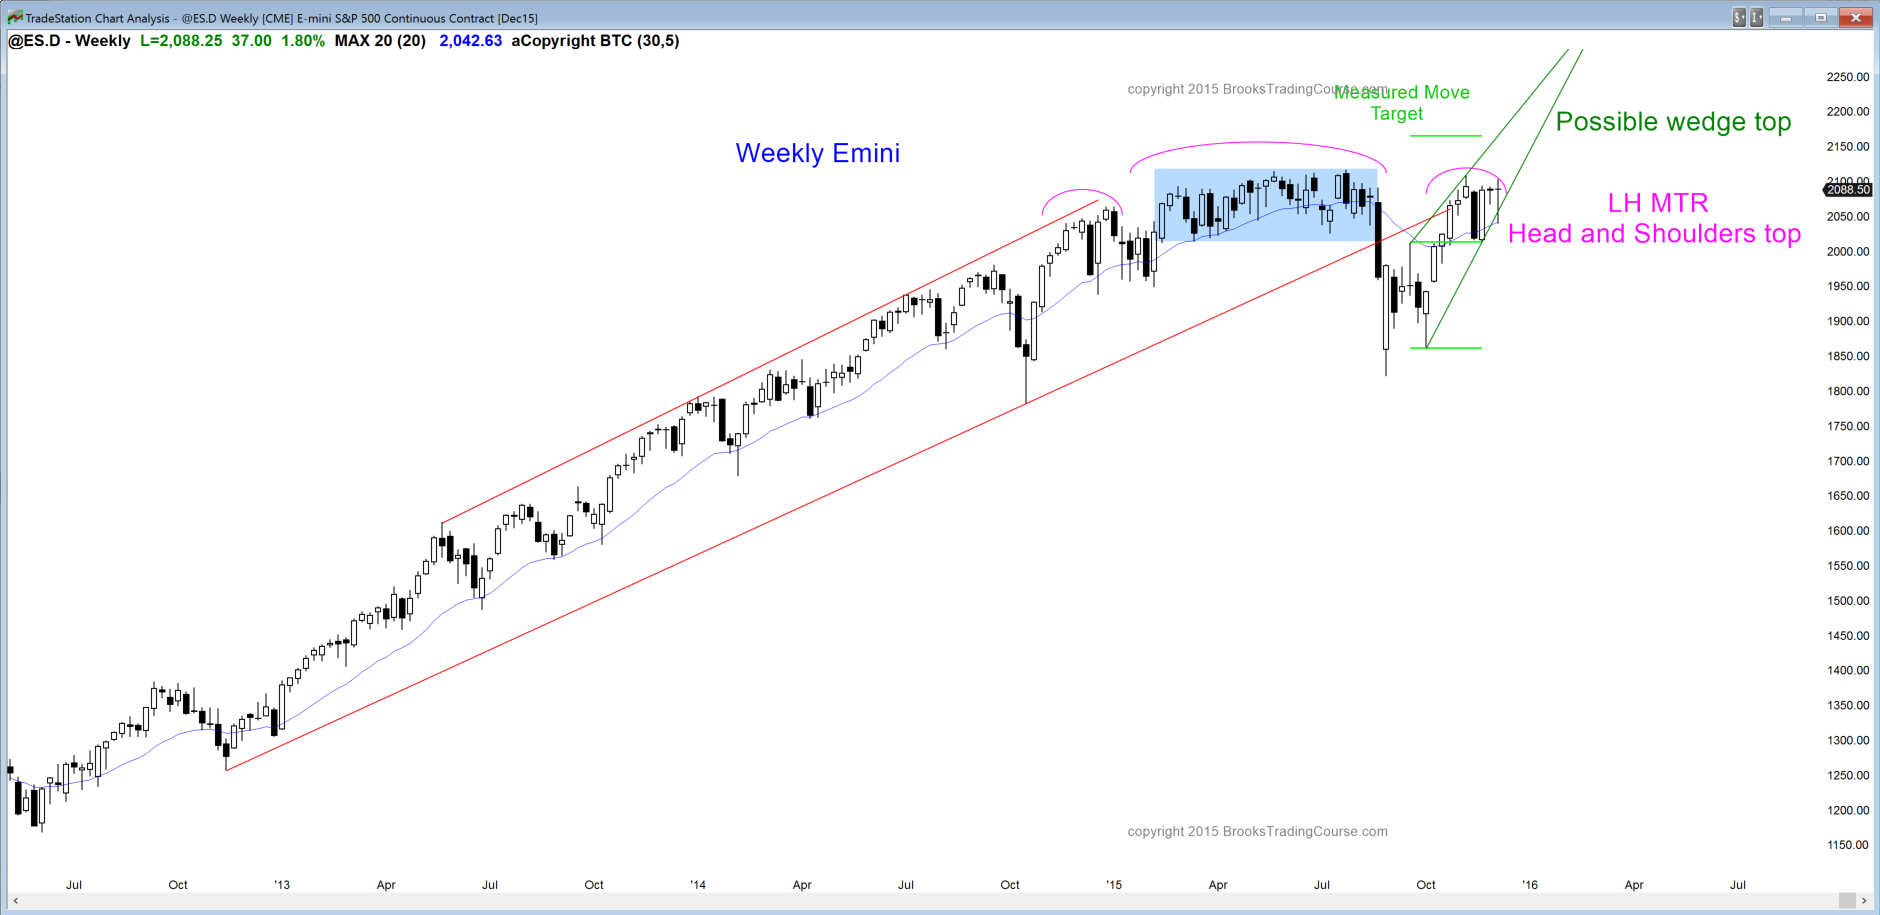
The weekly S&P500 Emini futures candlestick chart’s rally is also the right shoulder in a head and shoulders top. The 6 strong bull trend bars up from the October low represent strong buying pressure. This makes the market resistant to reversing down without 1st entering a trading range. The trading range has lasted 4 weeks and has not generated much selling pressure. This makes sideways more likely than down, despite the sell signal.
Although the Emini rallied strongly on Friday, it was only enough to create a doji candlestick pattern on the weekly chart. The prior week was also a doji. This is trading range price action and it is occurring in the middle of the trading range of the 1st 7 months of the year. It increases the chances of more trading range price action next week. The Emini might be waiting for the Fed interest announcement in 2 weeks before breaking out up or down.
Daily S&P500 Emini futures candlestick chart: Breakout mode
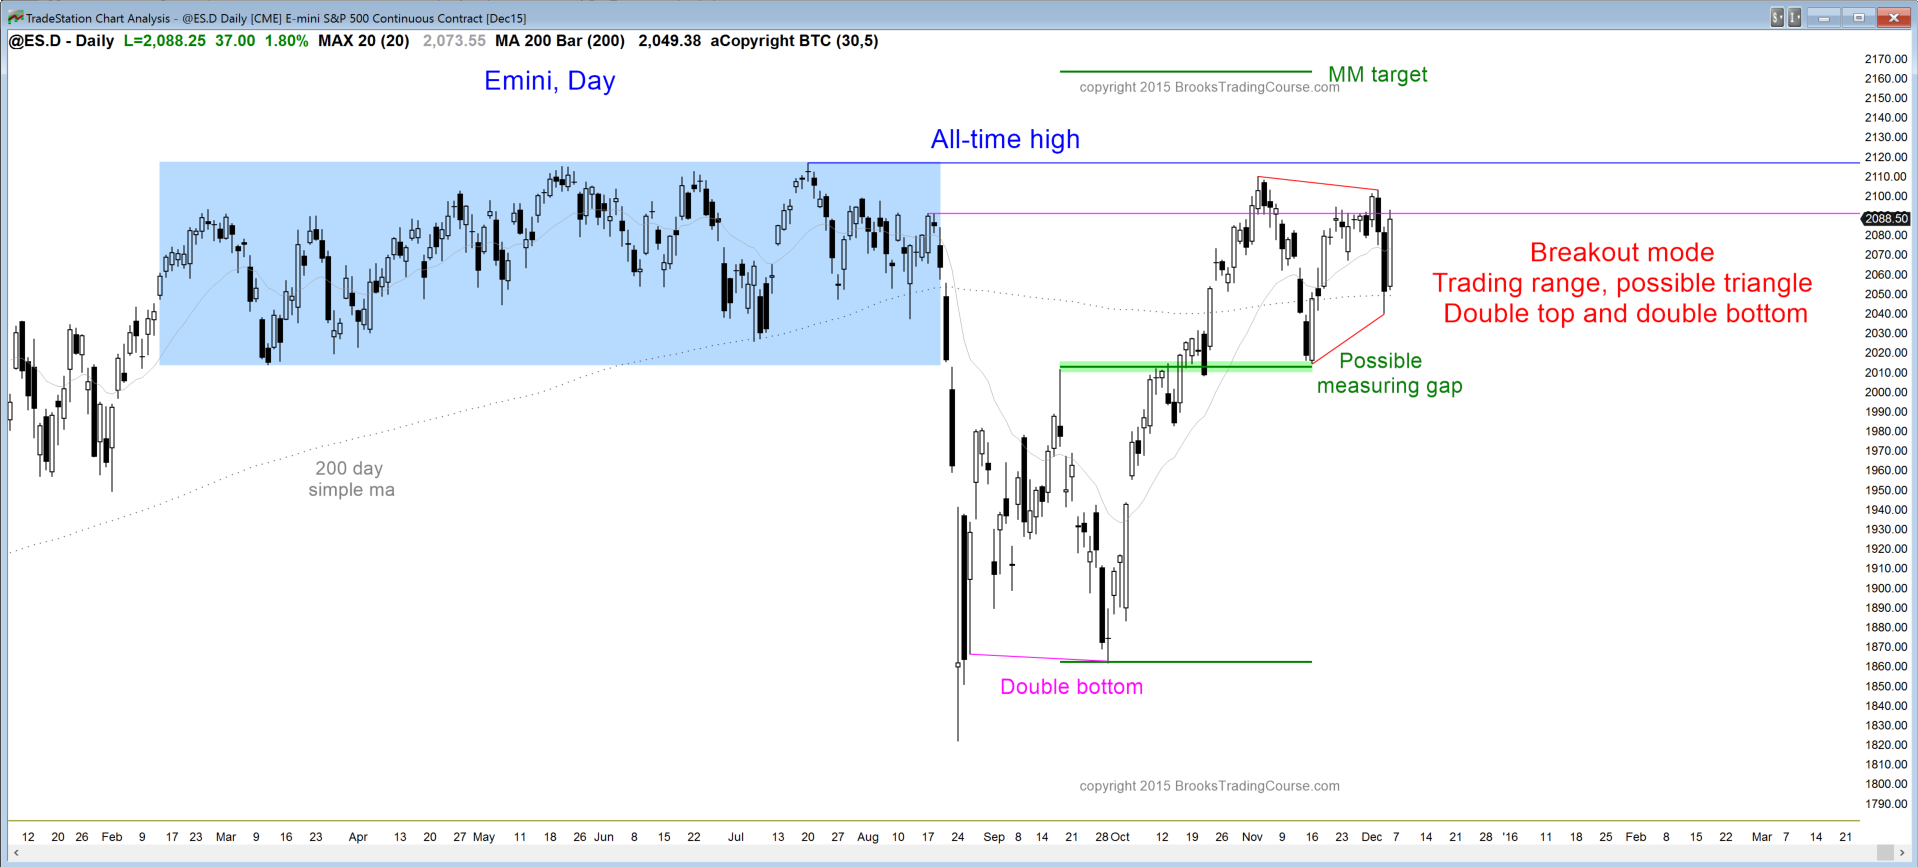
On the daily S&P500 Emini futures candlestick chart, the bulls broke above a 7-day tight trading range this week, but could not get above the November high. It then reversed down strongly for 2 days.
Since the October buy climax, I have written many times that the most likely price action after the buy climax was a trading range. I said the range would probably have both a double top and a double bottom. With today’s reversal up, the Emini has formed the double bottom with the November 16 low, although yesterday’s low was a higher low. The selloff this week formed a double top with the November 3 high. The trading range now has its double top and bottom and is in breakout mode. There is about an equal chance of a breakout up or down.
As long as it is in the trading range, most traders are expecting the trading range to continue. They buy low, sell high, and scalp. Once there is a strong breakout up or down, traders will switch to swing trading. Because today formed a double bottom on the daily chart, the Emini will probably test a little high next week. If it does and then stalls, the trading range will become a triangle. That does not add more information. A triangle is a breakout mode setup, but with the double top and bottom, the Emini is already in breakout mode.
I wrote about the interesting math last weekend. The probability is about the same for the bulls and the bears on the daily chart, but the bears have a tighter stop (above the November high). This means that the daily chart has an easy setup for the bears. They sell for any reason around the November high, with a stop above the all-time high, look for a test of the October low. Why aren’t a lot of traders taking this trade? Because it might take months to play out, and they are traders, not investors. They want to make money every day. They do not want to tie up their money for possibly several months and not make any return on it.
See the weekly update for a discussion of the price action on the weekly candlestick chart and for what to expect going into next week.


 Review")


