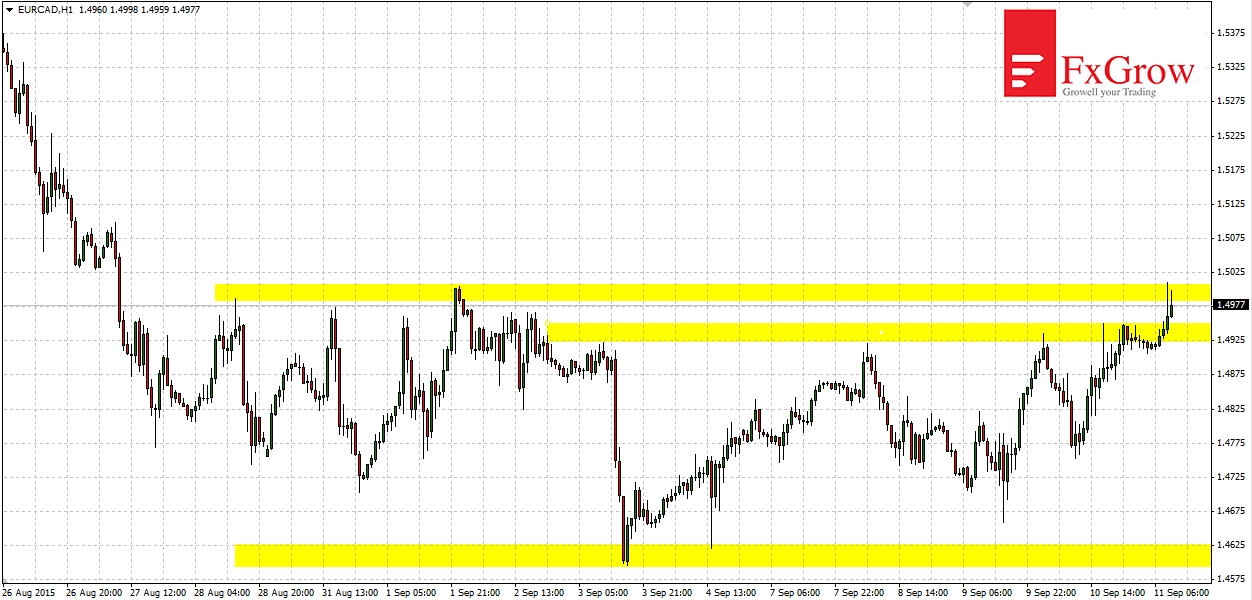
Time-frame H1
On 28 August EURCAD moved in a side trend between support 1.4600 and resistance 1.5000. Since the beginning of September another resistance at 1.4920-1.4940 was formed, which today was broke from below. After breakout, the price has moved up about 50 pips where was stopped by even stronger resistance 1.5000. If this next resistance will be broken, the next targets will be in sequence 1.5200, 1.5430 and a peak of August 24 1.5560. However, if the bulls not be able to sustain upward movement and the price will return below 1.4940, the test of the March bottom on the level 1.4600 would be likely.
Wider view D1
EURCAD since April 2015 moves in upward channel. At the end of August we saw an unsuccessful attempt to broke above the Upper limit of the channel, which resulted in return to its lower band. Bulls started their purchases and there has been a rebound. After breakout strong resistance at 1.5560 has been tested. Price in the long term moves in a downward trend. 1998, 2008, 2014 highs, were followed by lower tops and lower lows.


 Review")


