The EURGBP pair has been on an upward trend since early May. When we link the minima and maxima of this trend, an uptrend channel appears on the chart.
Since the channel was formed after a period of fairly strong declines, we can also call it a “flag” and the probability that the quotes will break out of this formation is statistically greater than the upward break-out (65%/35%).
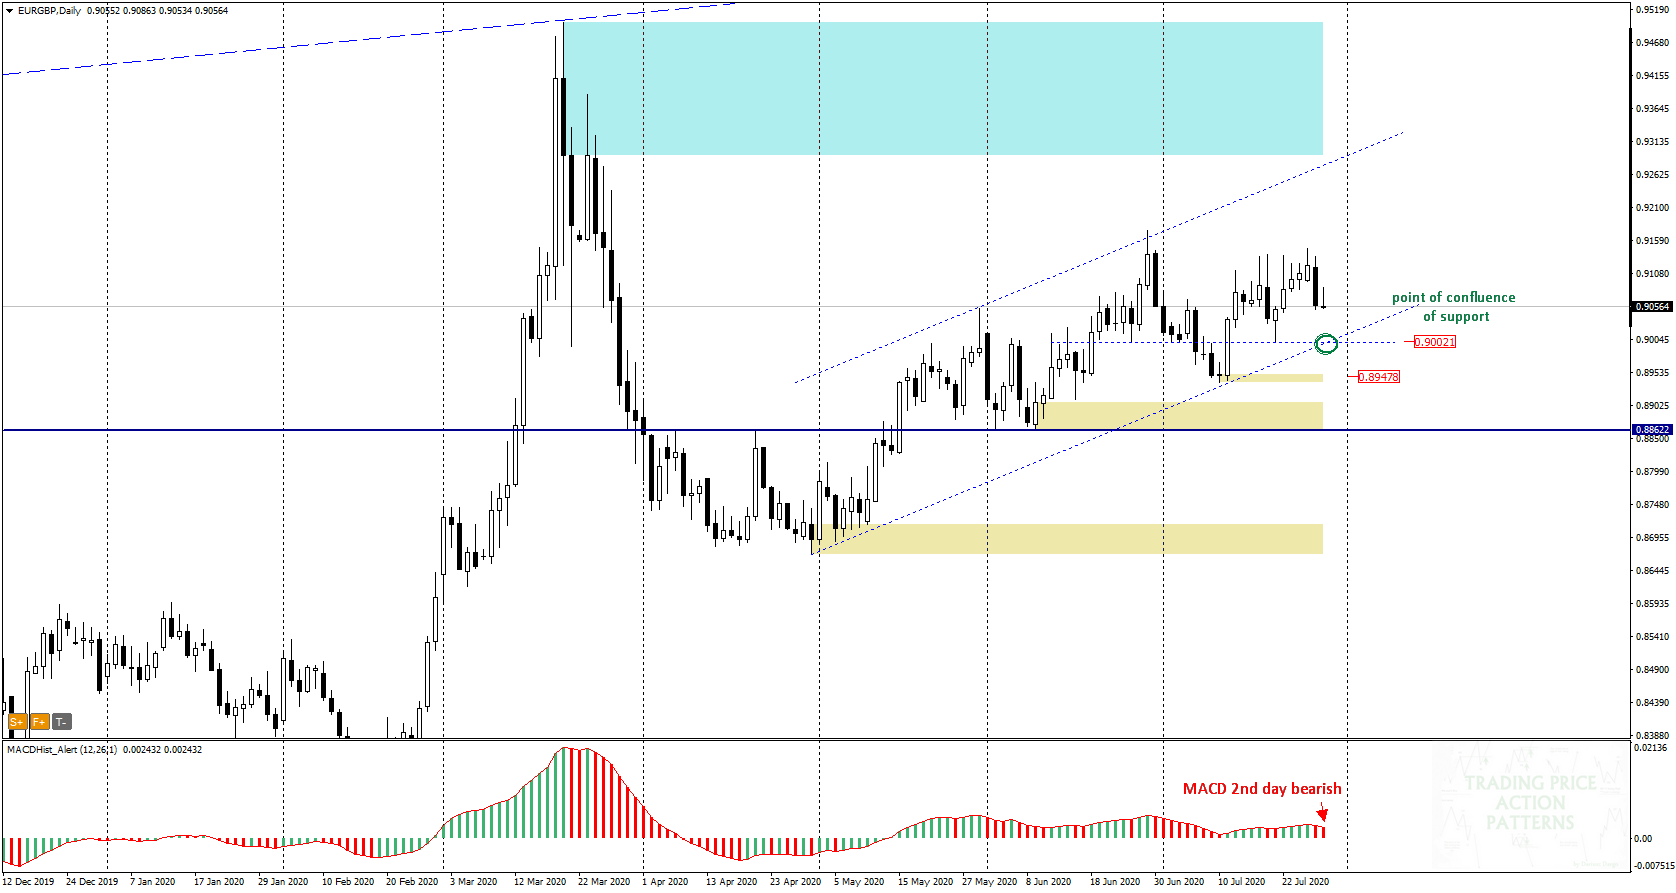
At the intersection of the S/R 0.9000 with the support of this channel, a point of confluence of support is created which can be a target of supply.
Visit my channel where I post trading ideas: https://t.me/TradewithDargo
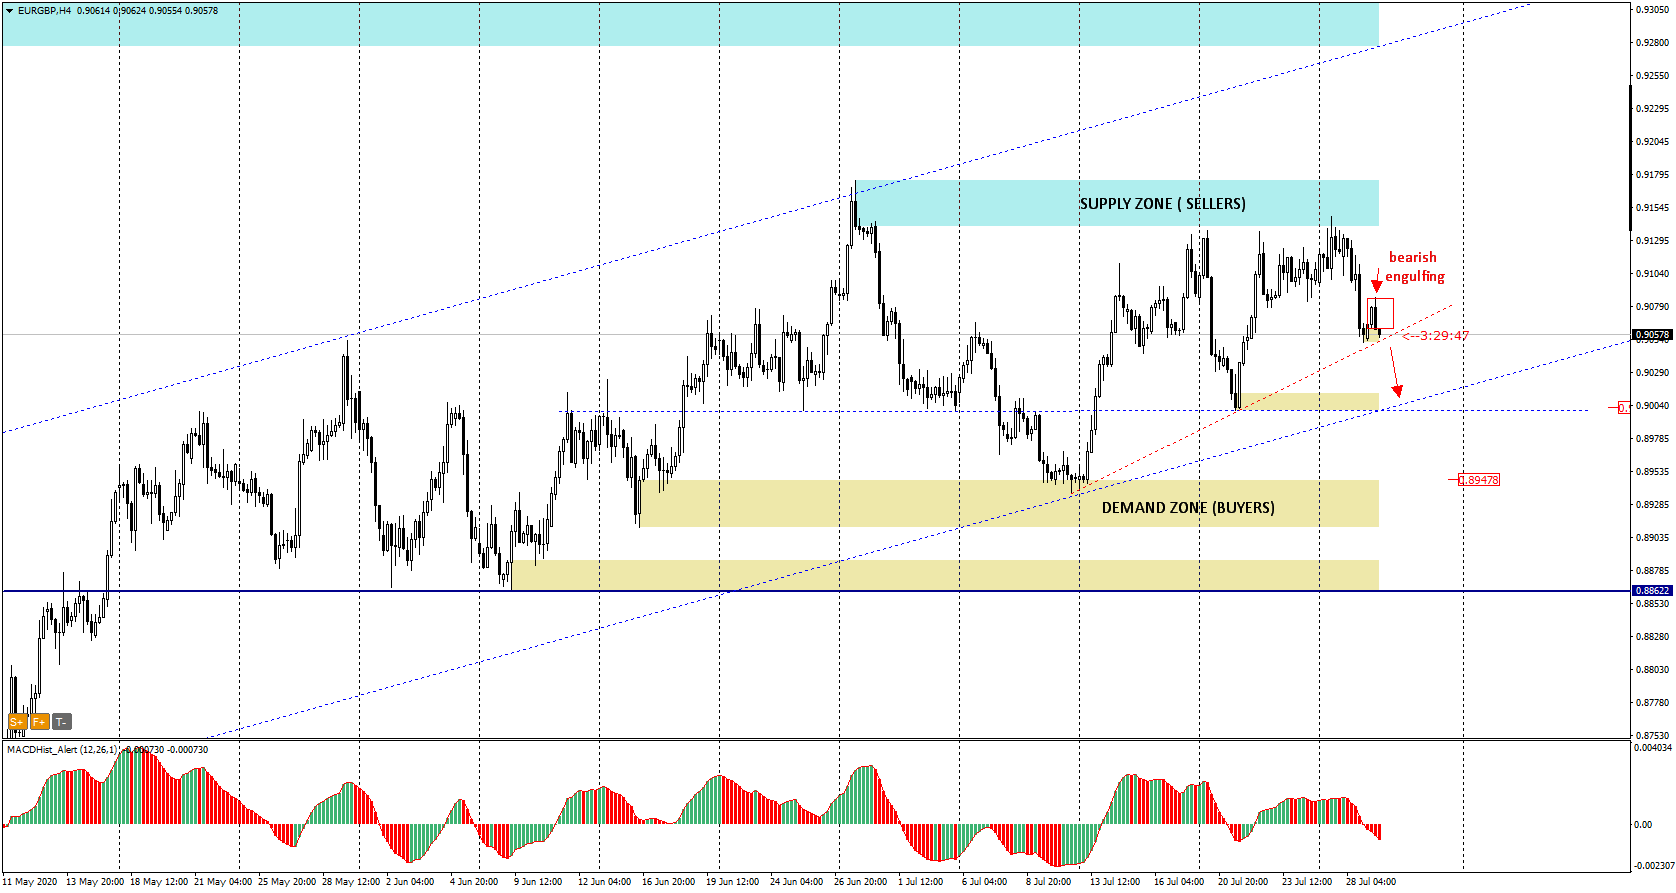
On the H4 chart we will notice that the last four-hour candle formed a bearish engulfing pattern. Overcoming the lower limit of the formation will be a signal for declines. We can also set a local trend line (red). Overcoming this line may accelerate the declines towards 0.9010-00.
 In our Facebook group, which you can join anytime: https://www.facebook.com/groups/328412937935363/ you will find 5 simple strategies on which my trading is based. There, every day we post fresh analyses of currency pairs and commodities. You can also visit my channel where we can post our trading ideas: https://t.me/TradewithDargo


 Review")


