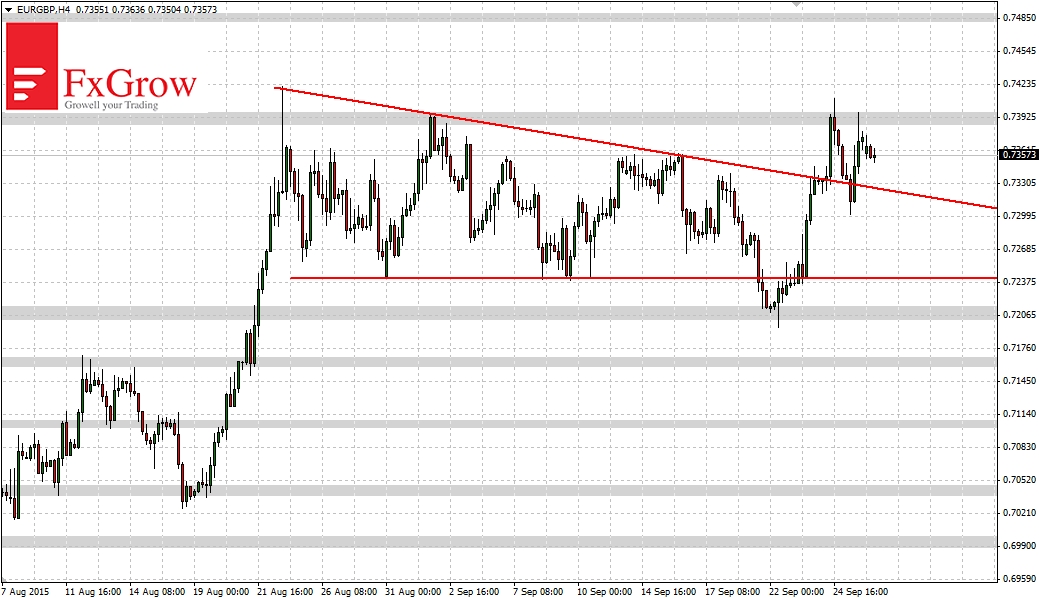
On September 21 was a break below the triangle. However already the first support on 0.7200 mobilized bulls to buy and on next day there was a return to inside the triangle. Using the situation that on chart is formation fakey (false breakout) the bulls were attempted broke above the triangle. It was successful. Upward movement has been stopped at 0.7400 and currently the price is moving between the triangle and resistance. If break above the level 0.7400 will be successful the next target of upward movement is 0.7480. However, if bulls show the weakness the price should return to inside the triangle again.
Try FX GROW. ECN & STP execution, full transparency.
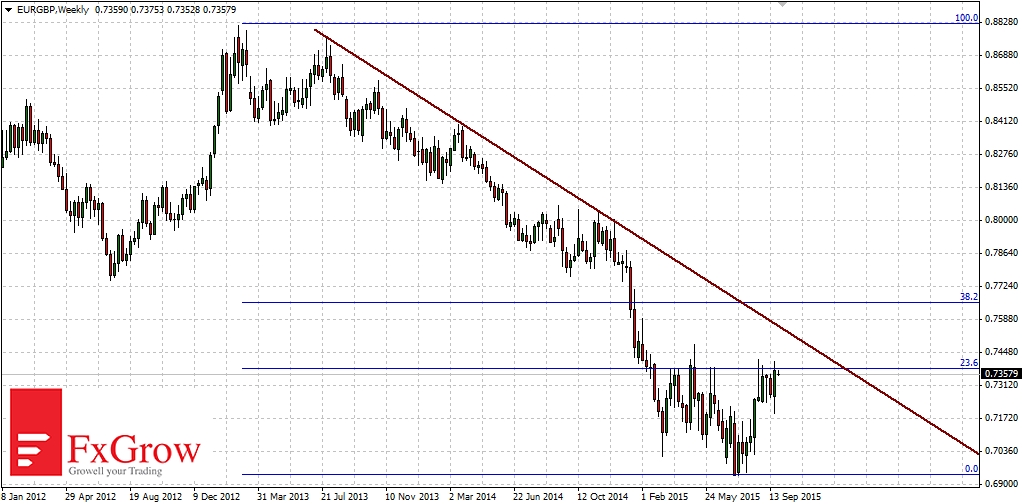
Wider view, interval W1
Since 2009 EURGBP moves in a downtrend. In this time price has fallen from 0.9800 to 0.6940. Currently rebound is in progress and move up abolished only 23.6% of the last downward movement. Level 0.7650 could be tested which is 38.2% fibo. Earlier, the bulls will have to deal with some resistance: 0.7480, 0.7550, 0.7590. The strongest of the indicated resistance will be 0.7550, which marks the downward trendline.


 Review")


