EURJPY is in an uptrend, where at the end of last week a maximum at 137.49 was set, which additionally tested the resistance in the form of the upper limit of the ascending wedge formation.
The current week began with declines from the aforementioned high and as can be seen in the daily chart below, the quotations are already struggling with the confluence of supports, where the horizontal area at 134.40 coincides with the trend line (wedge support) running from the August 2017 low.
I trade on this instrument at broker XM, which has in its offer more than 300 other assets >>
It may seem that a lot depends on the result of this test, because if the rate at the closing of the session manages to break the support zone, the quotations may continue to go south. Then the way to key support in the vicinity of 131.40 would be open.
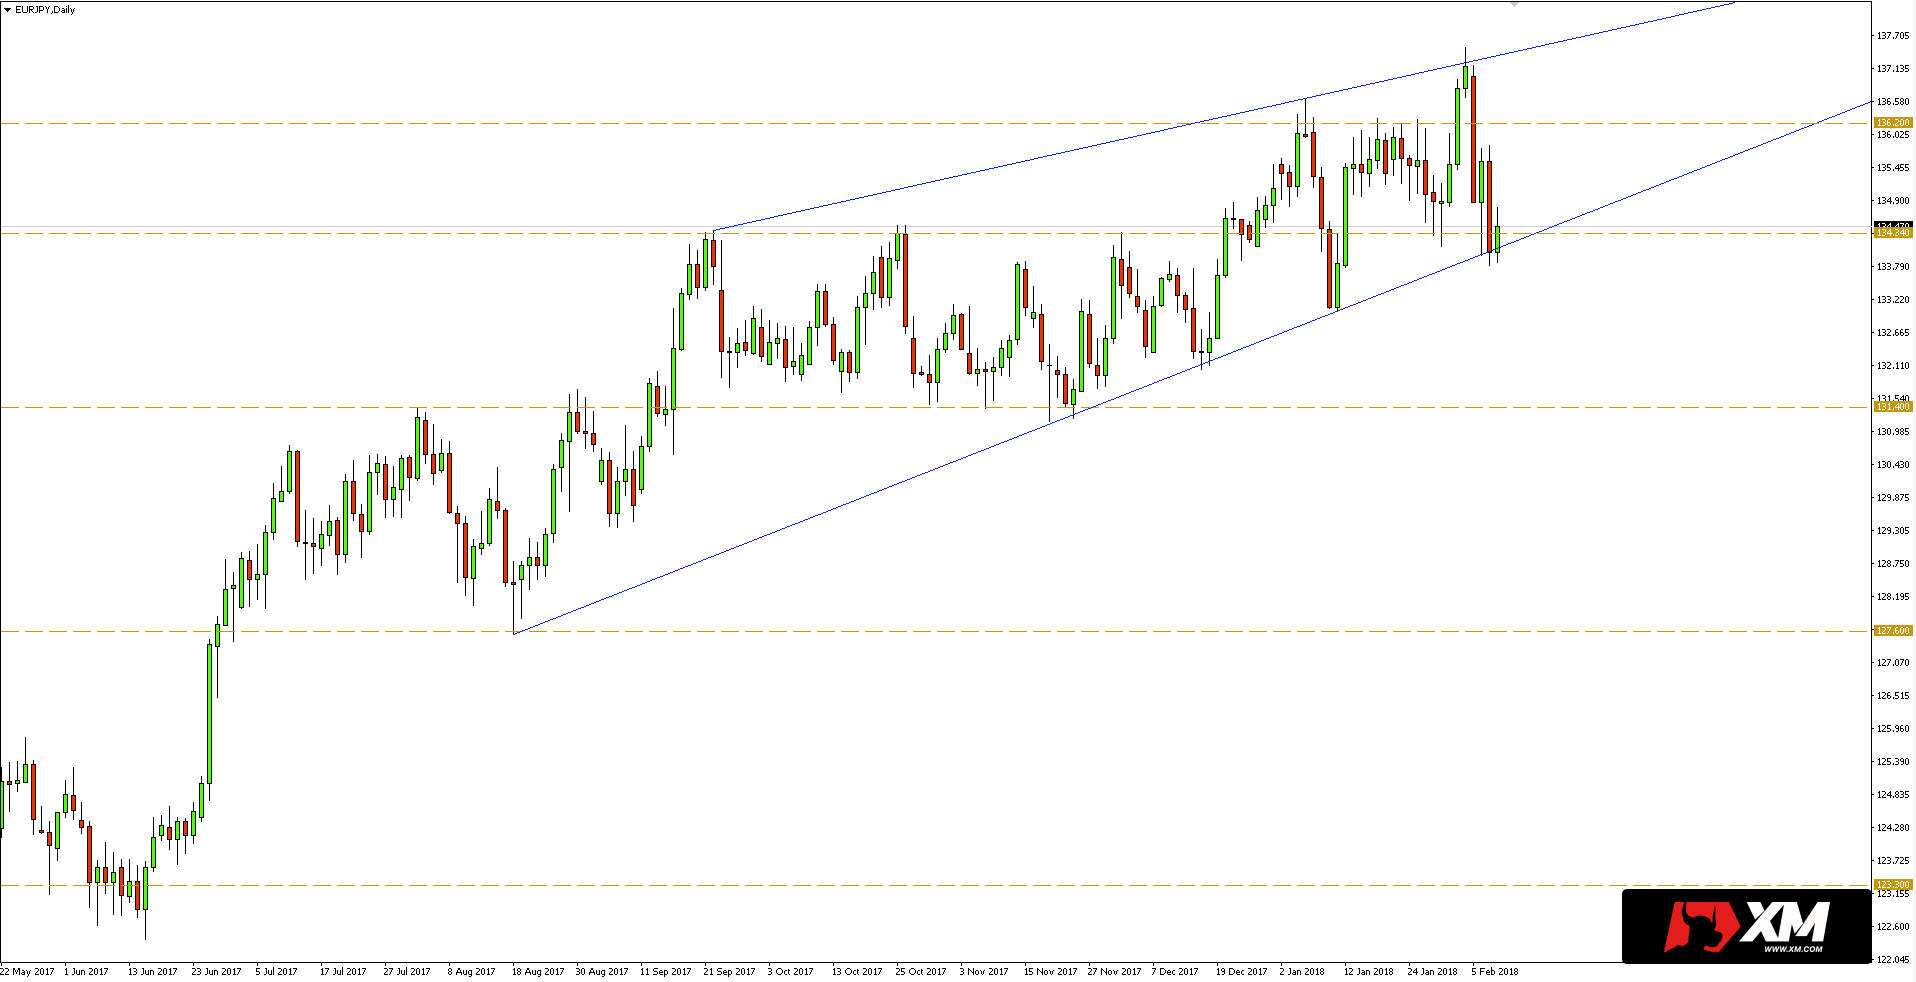 If, however, the support being tested is able to withstand, on the way from the current maximum, the buyers may still resist around 136.20.


 Review")


