As a result of declines since December 2014 EURJPY reached 111.00, which coincided with 70.7% retracement of the Fibonacci correction from earlier increases, where the demand response occurred. It is worth noting that although this level was defeated as early as in December 2012, it was only its first re-test. Since then, we have seen increases again. It is worth noting, however, that the market has overcome a very important resistance at 127.40 which may support continuation of this trend over a longer time horizon.

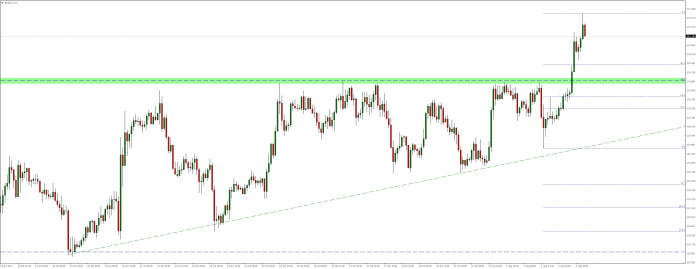
Looking at H4 chart, we will notice that after market broke mentioned level, market quickly tested and rejected 127.40 as support and nearly for a month continued moving in consolidation, from which only today broke out. Direction of breakout is accordant with previous trend, and if only re-test and rejection of the upper limit of this consolidation would happen in near future, we could expect continuation of bullish trend.

Current situation on this instrument is worth observing on H1 chart where we find that the support coincides accurately with 50% of Fibonacci adjustment from the last growth impulse.


 Review")


