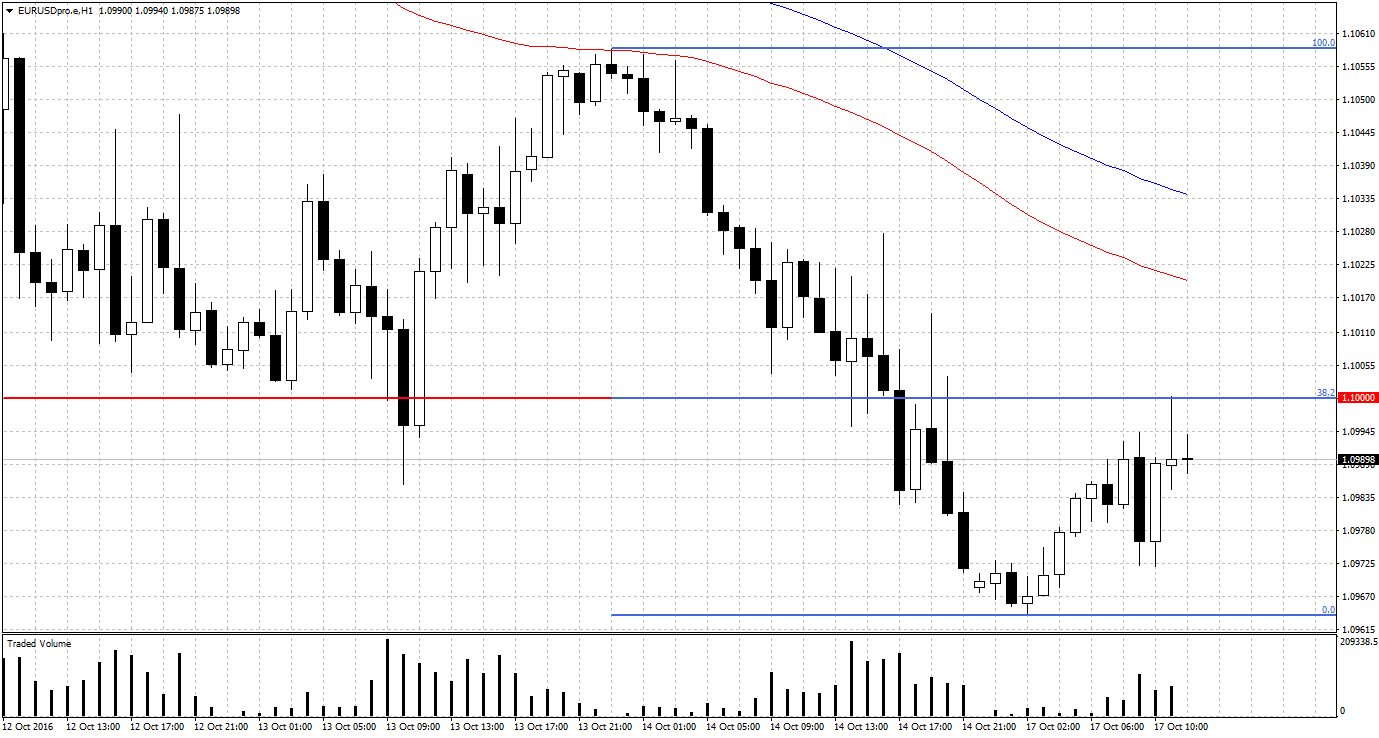
On the H1 chart EURUSD follows a downward trend, evidenced by a sequence of increasingly lower lows and lower highs. Another tool to determine the trend are moving averages EMA on H1 (75- and 100-periodic) which are directed towards the bottom. Price most of the time is below the above-mentioned EMA-s, declines are also characterized by increasing volume. We can see that according to our latest analysis increased bearish power appeared during the test of resistance zone 1,1030-1,1040. Then there was an increase in volume during the declines. Currently the price is below the round level of 1.1000.
The first test of the level was characterized by a candle with a low level of closure and higher volume. In the absence of continuing growth or low volatility, which will break the bottom of the above-mentioned candle, EURUSD will increase the chances for further declines. Next support is located at 1.0950 level.


 Review")


