EURUSD – failed to break out from consolidation
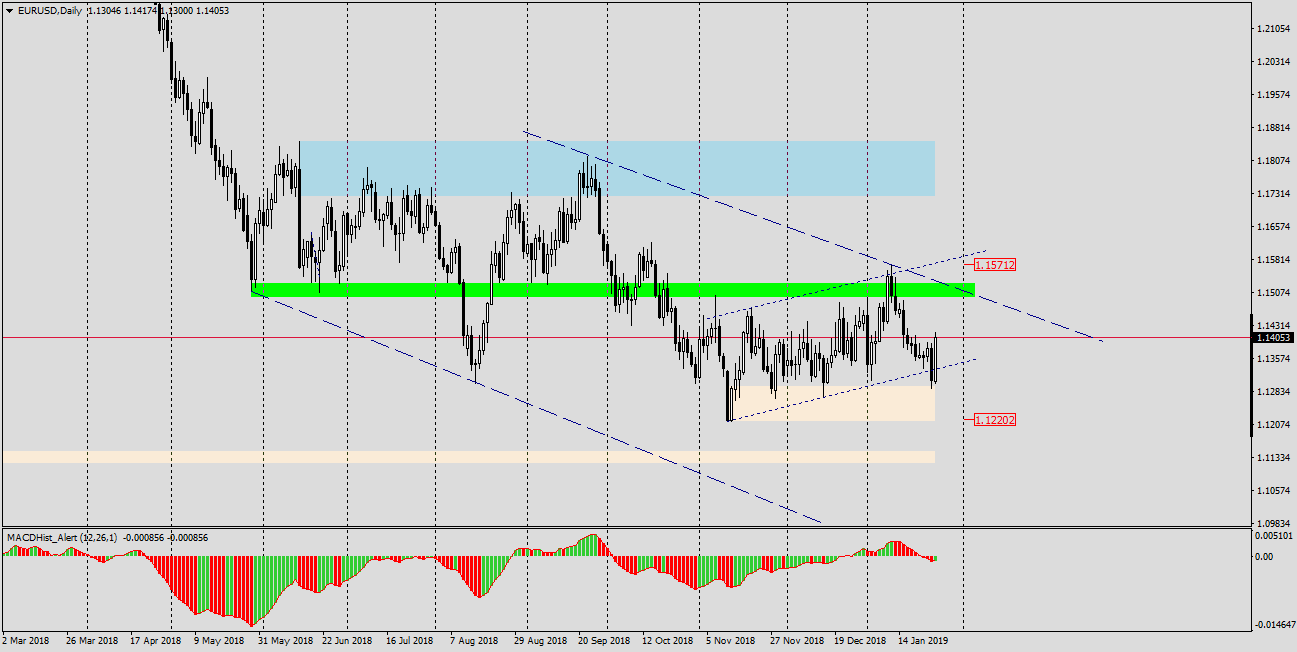
EURUSD has been moving since mid-November in a broad consolidation between 1.1220 and 1.1570. Last week’s ECB meeting and Draghi’s conference added some vigour to this pair, after quite abrupt falls on Thursday and overcoming the lower limit of this consolidation, Friday turned out to be bullish and the price was again in its range.
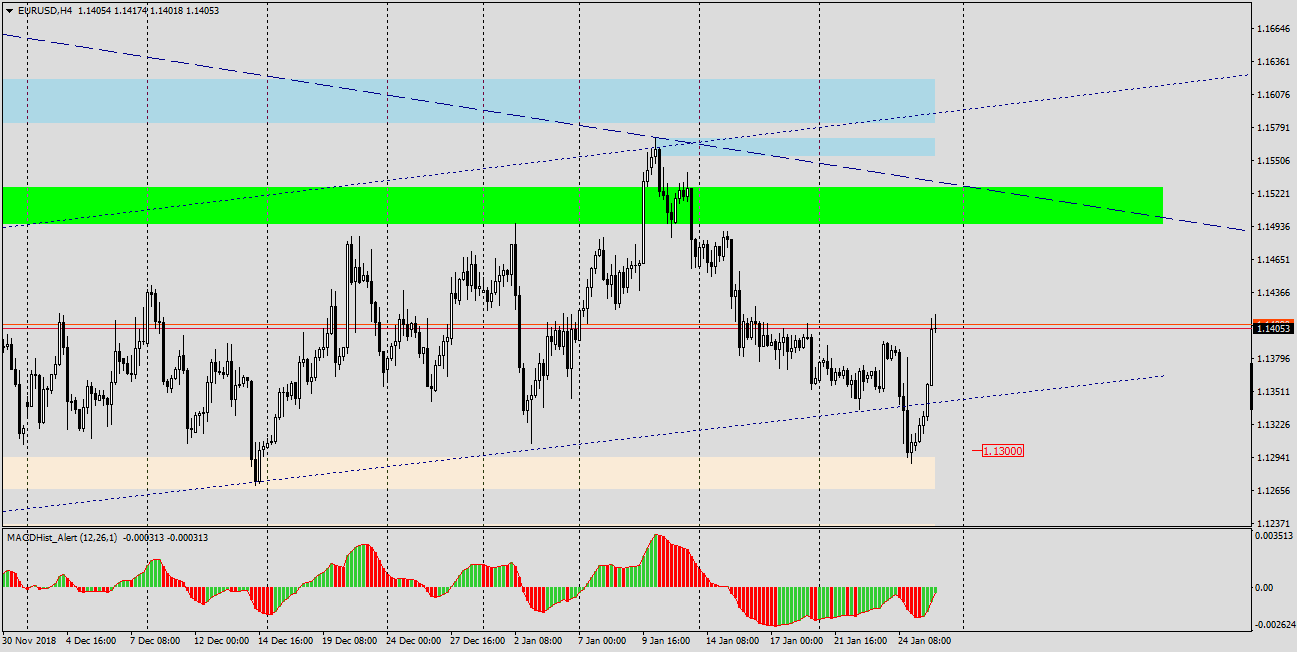
On Chart H4 (above) we see that the demand response at 1.13 was strong and the price beat the previous maximum without problems. Additionally, bullish divergence supports growth.
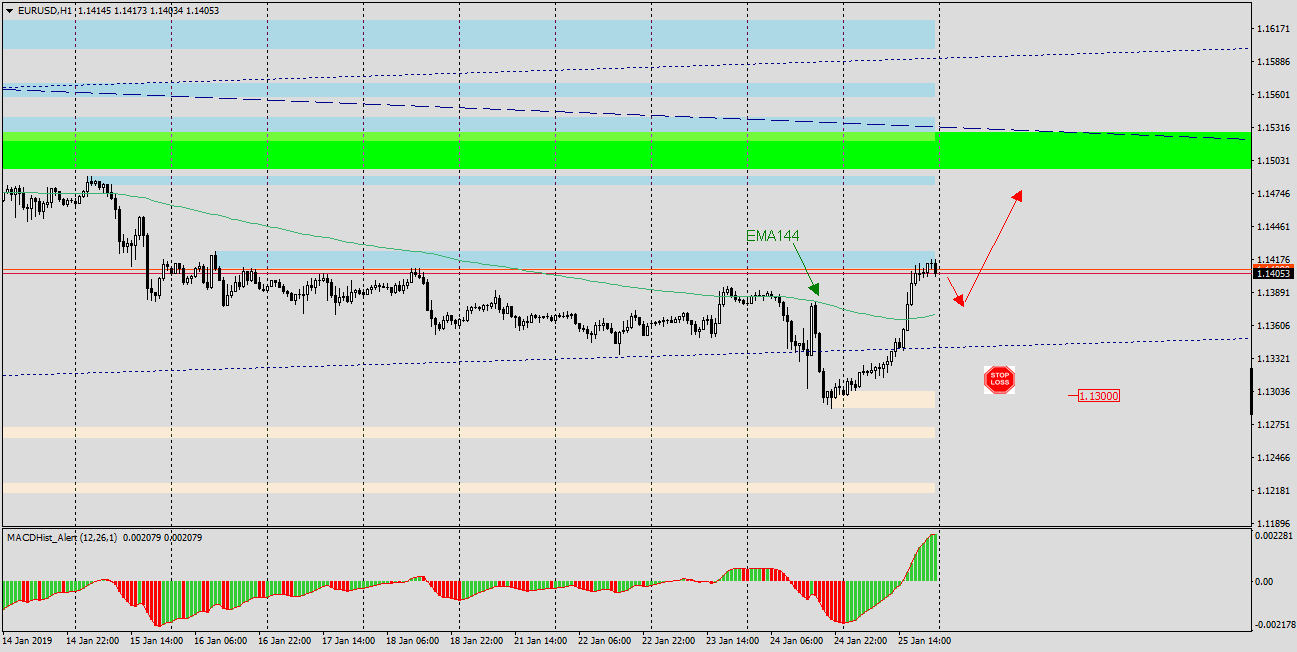
In order to find a good place to join the growth, it is worth looking at the H1 chart, where the average EMA144, which has recently acted as strong dynamic resistance, can determine our entry level, becoming a support for the returning price.
Join us in our new group for serious traders, get fresh analyses and educational stuff here: https://www.facebook.com/groups/328412937935363/


 Review")


