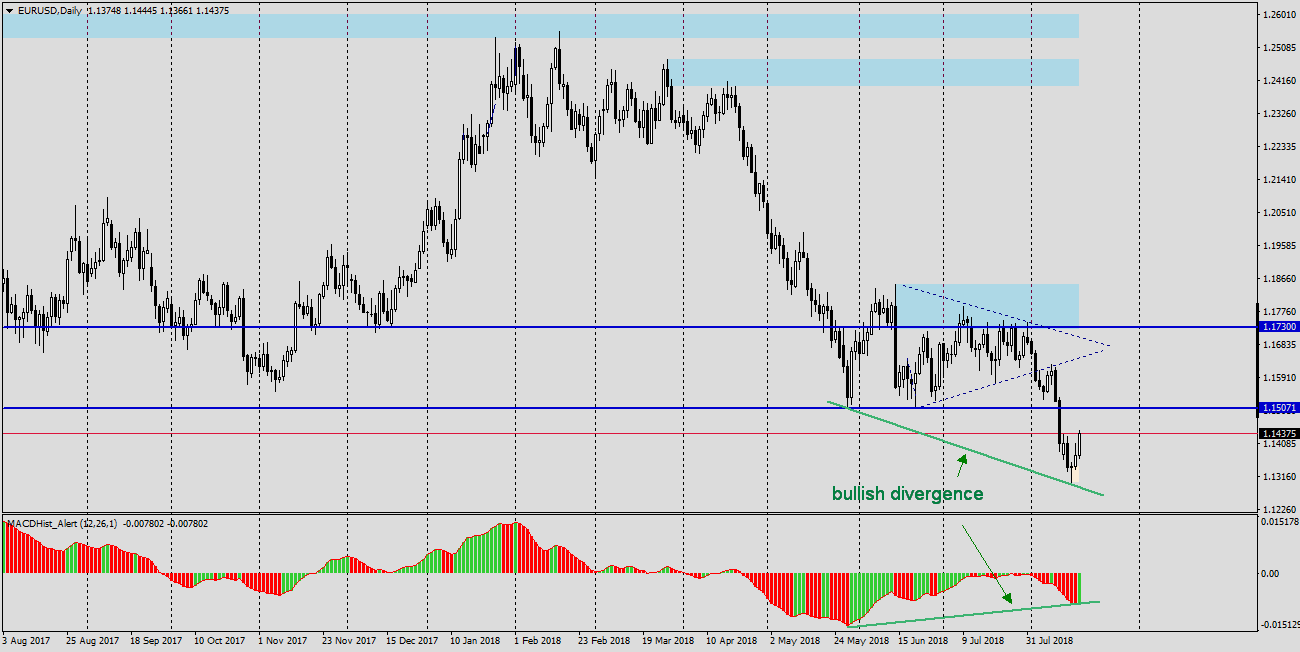
EURUSD – since the middle of June, the price has moved in consolidation, and its upper and lower limits formed sides of a triangle. At the beginning of August, the bottom was broken and after retest from the bottom of the defeated support of the triangle, the quotations went south.
From Wednesday, 15.08 quotations start to u-turn, and the last session of the week ended with a fairly clear bullish candle, which was accompanied by creating of a minimum on the MACD oscillator and the oscillator began to grow, which indicates the beginning of a bullish divergence on the Daily chart.
When we look at the H1 chart, we notice a well known iH&S formation where the neck line (violet) was successfully defeated on Friday. Also worth noting that the average EMA144 also has already been defeated by the price.
So we have three factors that point to increases:
– divergence on D1
– iH&S on H1
– the price has gone above the EMA144
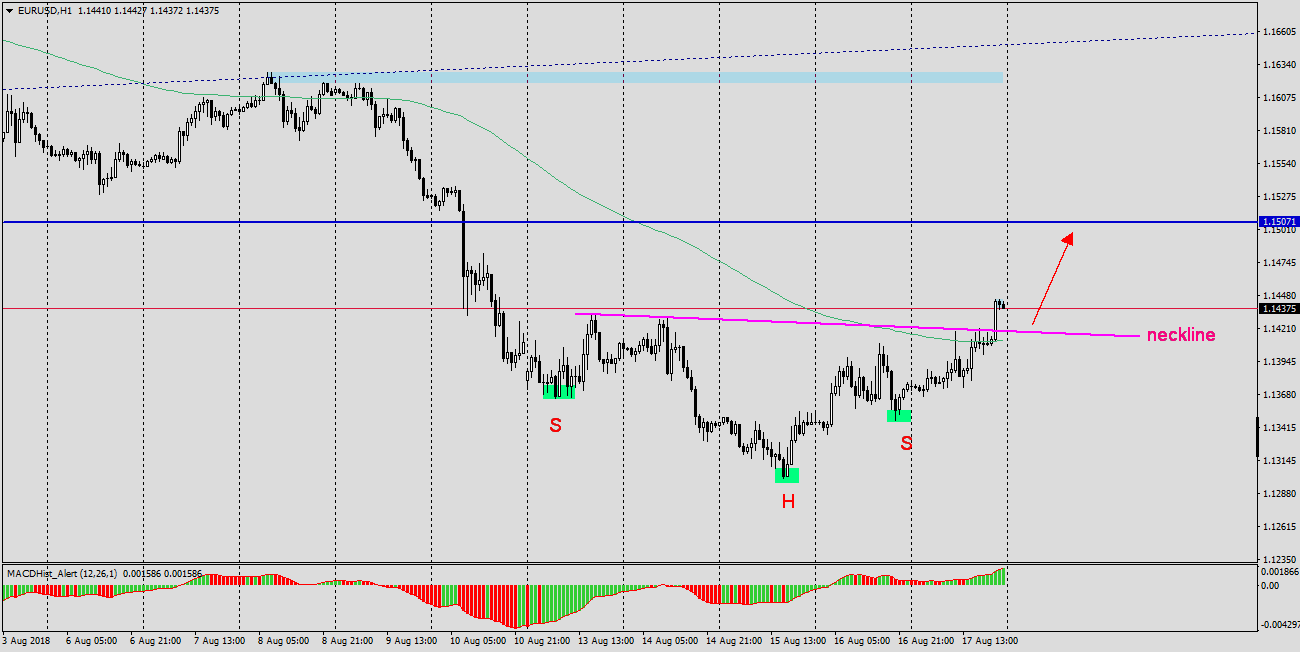
The best place to open a Buy order will be the area of the broken neck line, if the quotes go back to it. Negation of the upward scenario, and in principle the upward correction (because I think that it is generally not the end of the declines on EURUSD) may occur in the case when the price clearly falls below the mentioned neckline after closing the next daily candle.
Analyzing the graphs I used two strategies: EMA144 and PA+MACD, which description can be found on the portal.


 Review")


