One of the stars of Asian session was New Zealand dollar. Forming since beginning of February triangle pattern on NZDUSD was today broken by bulls. Was it false breakout?
In the case of triangles, flags or pennants patterns there are two ways to play them. The second and third one are treated as continuation of trend patterns, so very often breakouts are played. The candle which closes outside bands of pattern is buy or sell signal. Both in continuation of trend patterns such as flags or pennants and in case of triangles we can wait for re-test of broken area. This is the situation happening right now on NZDUSD.
Trade with others. Join eToro community and use experience of other traders!
Pair dynamically increased after revision of inflation expectations – in next two years they rose form 1.68% to 1.92%. Solid base of New Zealand’s economy and today’s inflation update caused bulls to take control, at least so far.
Despite that since early morning NZDUSD is losing rapidly – mainly because of bears who think that this is a good place to speculative selling kiwi. Pair currently tests stronger support in area of 0.7300. Over there is not only round level which makes psychological pressure on market participants but also lower band of triangle and moving average form last 8 days.
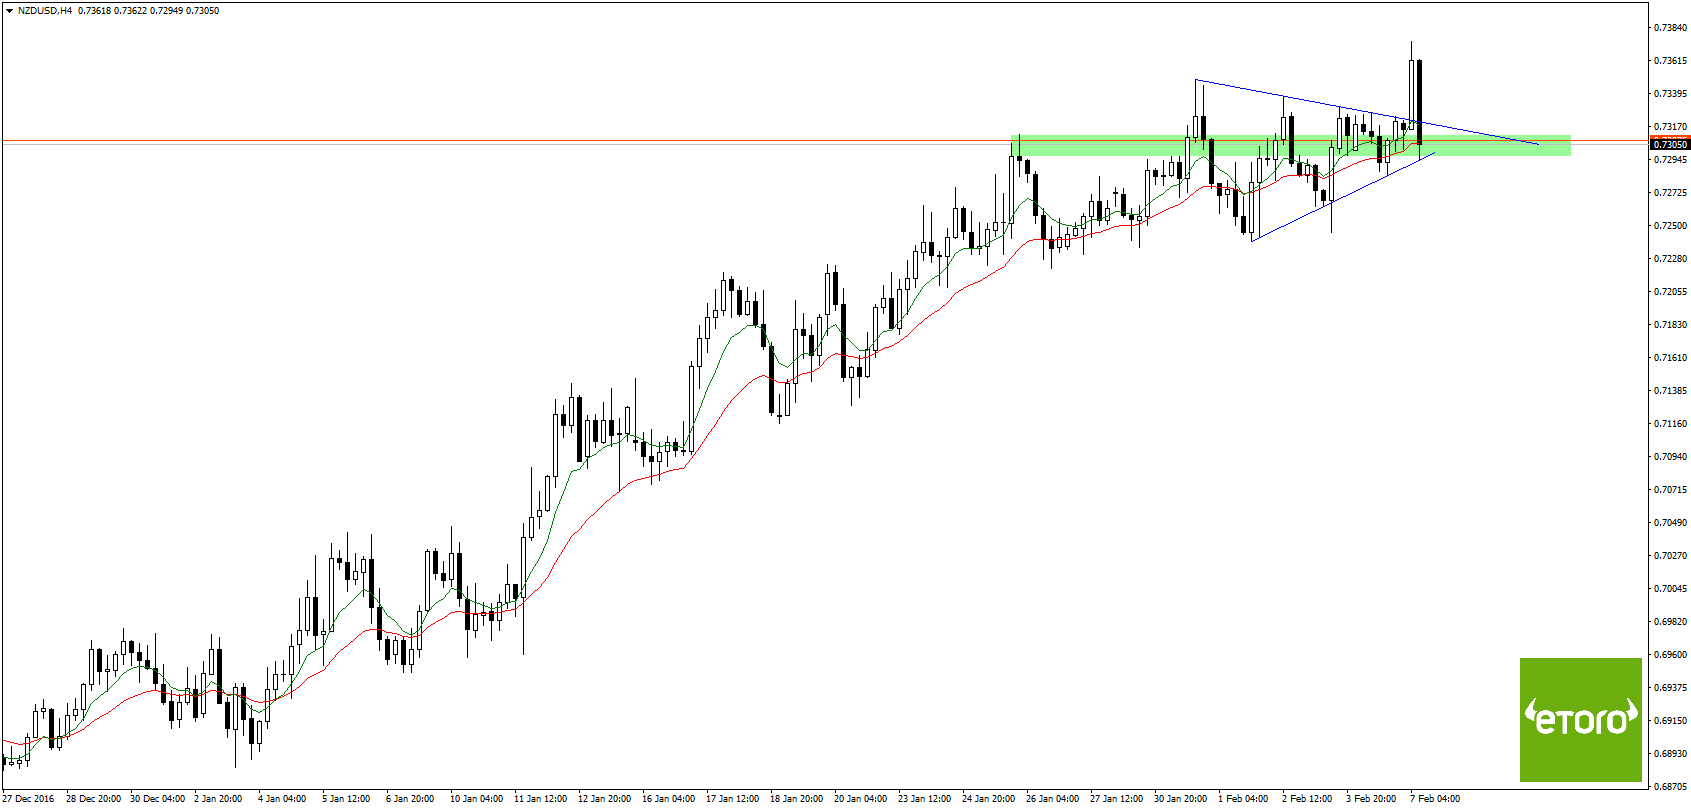
In connection with bullish trend on NZDUSD we can assume that 0.7300 area is a potential place to buy. Minimal range of gains reach in this case 0.7400 where there are highs from November 2016.


 Review")


