Hello traders, what’s going on market after US closing?
NZD/JPY
Almost formed pinbar which showed up on chart last Friday is still active and might be a good reason to open a short position on NZD/JPY. Then, it was only an almost pinbar candle which wasn’t anything special looking at strong upside pressure which appeared on pair last week. But after last two sessions we can admit, that price is under a key level demand zone marked green. Medium term trend is still downside, so selling NZD/JPY from current levels wouldn’t be a mistake. But first of all, we need to check calendar to see that tomorrow RBNZ will decide about future level of interests which definitely will have a strong impact on NZD. 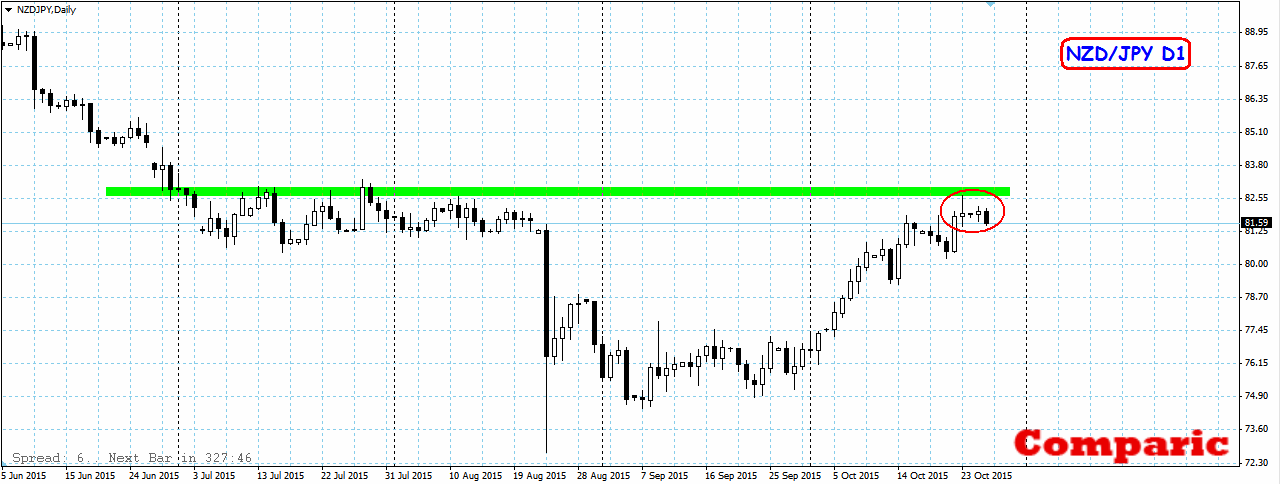
AUD/CAD
As interesting as previous chart. If daily candle close as a classic pinbar it will be a signal for further decline of AUD/CAD. Todays range catched on demand zone marked green, and sell signal slots in medium term trend. A scope of probable decline is pretty impresive, because looking at previous downside impulses it might be found at last lows level. 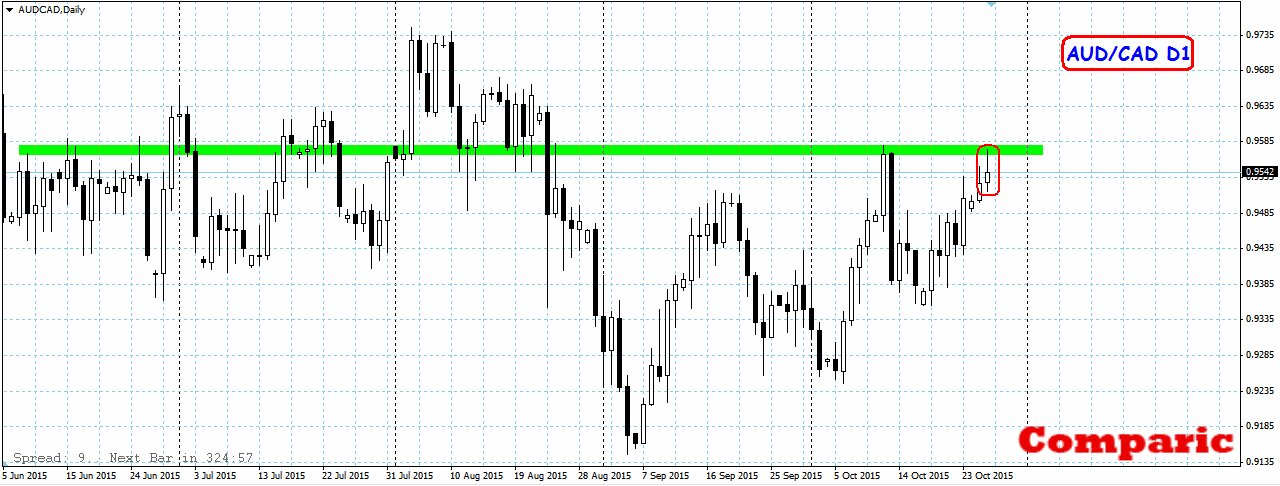
GBP/AUD
Last but not least. Almost identical situation as on AUD/CAD – market is trying to create a pinbar on a daily chart. If it happen, we will have a signal for a further rise, started October 13th. The price oscillate above local supply zone, and three last candles have its lows at simillar levels. Medium term trend is definitely bullish, so narrow space created by blue line and a green supply zone shouldn’t really bother You. Blue level line is somehow appropriate place to secure hypothetical long position. 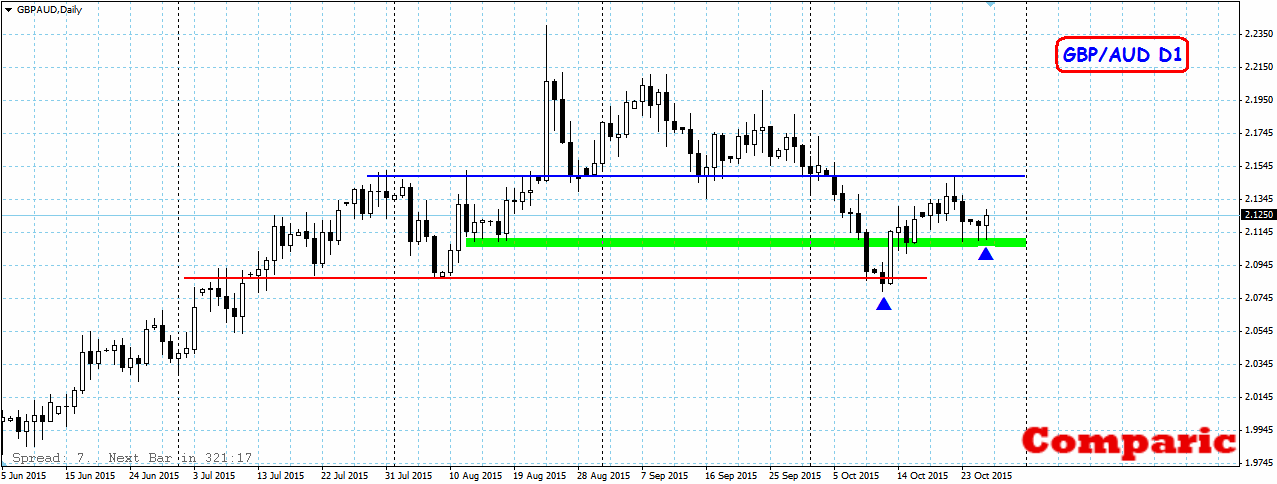


 Review")


