The British-Australian currency pair has been moving in an uptrend since the beginning of this year, which has taken the shape of a channel since June.
- Inside bar on annual maximums
- downward divergence suggests declines
- price stopped on confluence of supports
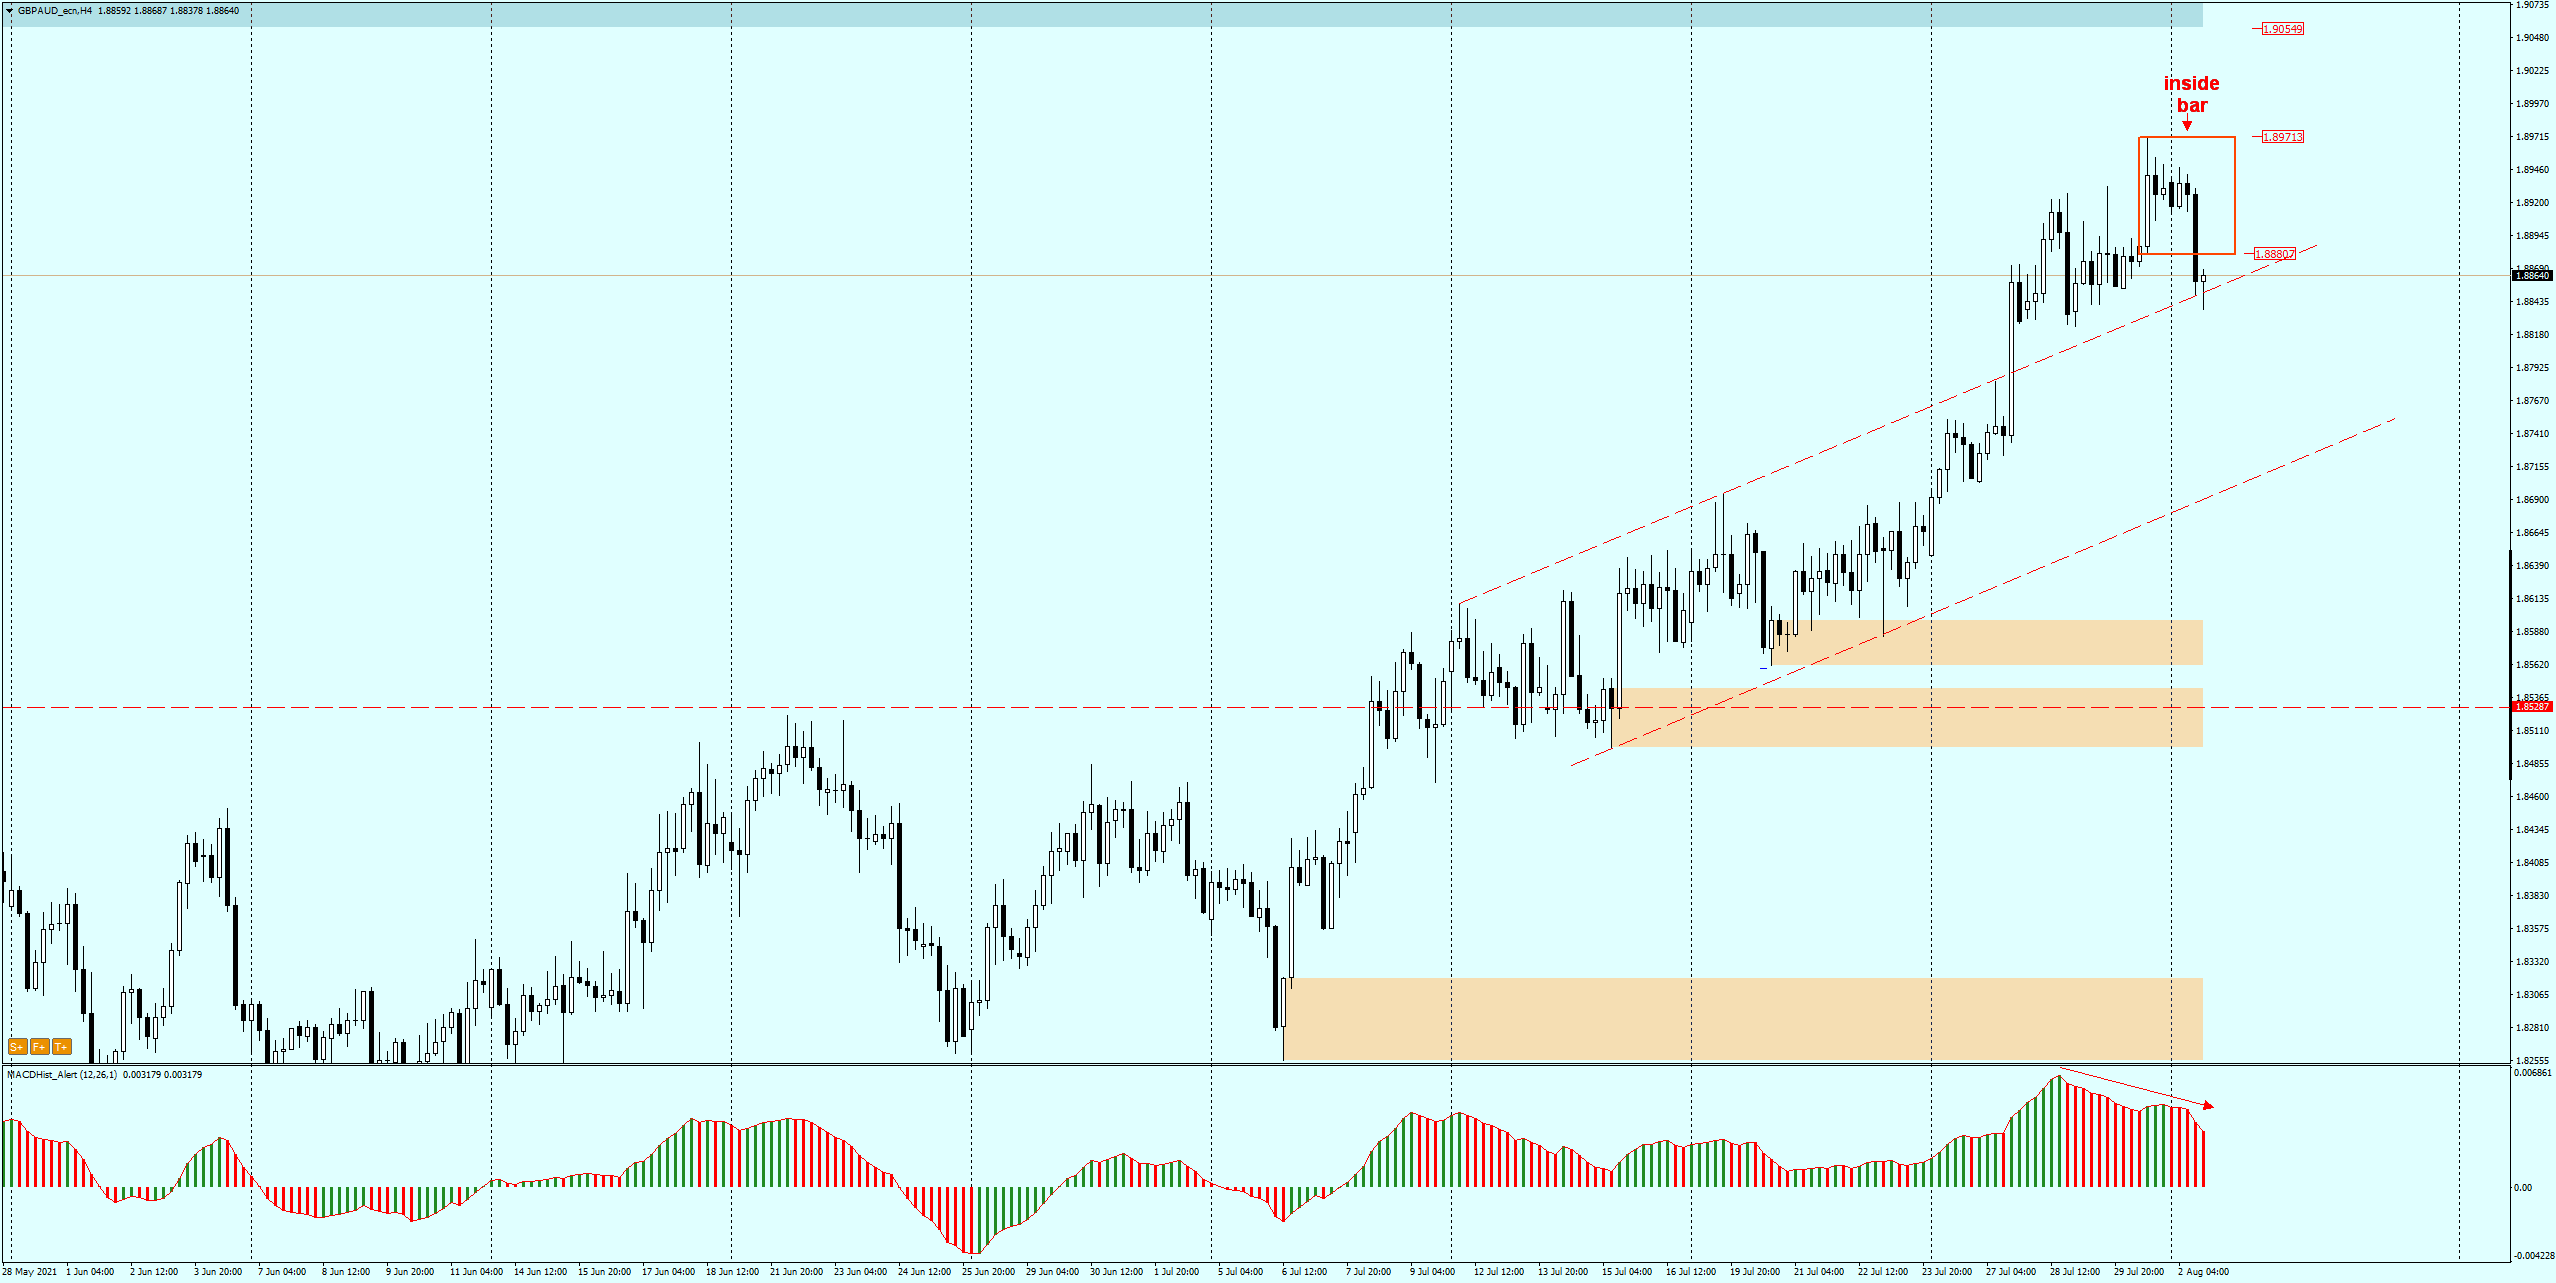
After overcoming the level of 1.8530 the pace of growth gained momentum and during the last month the price rose to 1.8970. After reaching the maximum of this year the price is falling and August opens with a large downward candle.
On the H4 chart we can see that an inside bar formation appeared, formed by the 4-hour candle from July 30. Today we observe the breakout from this formation downwards, accompanied by a downward divergence.
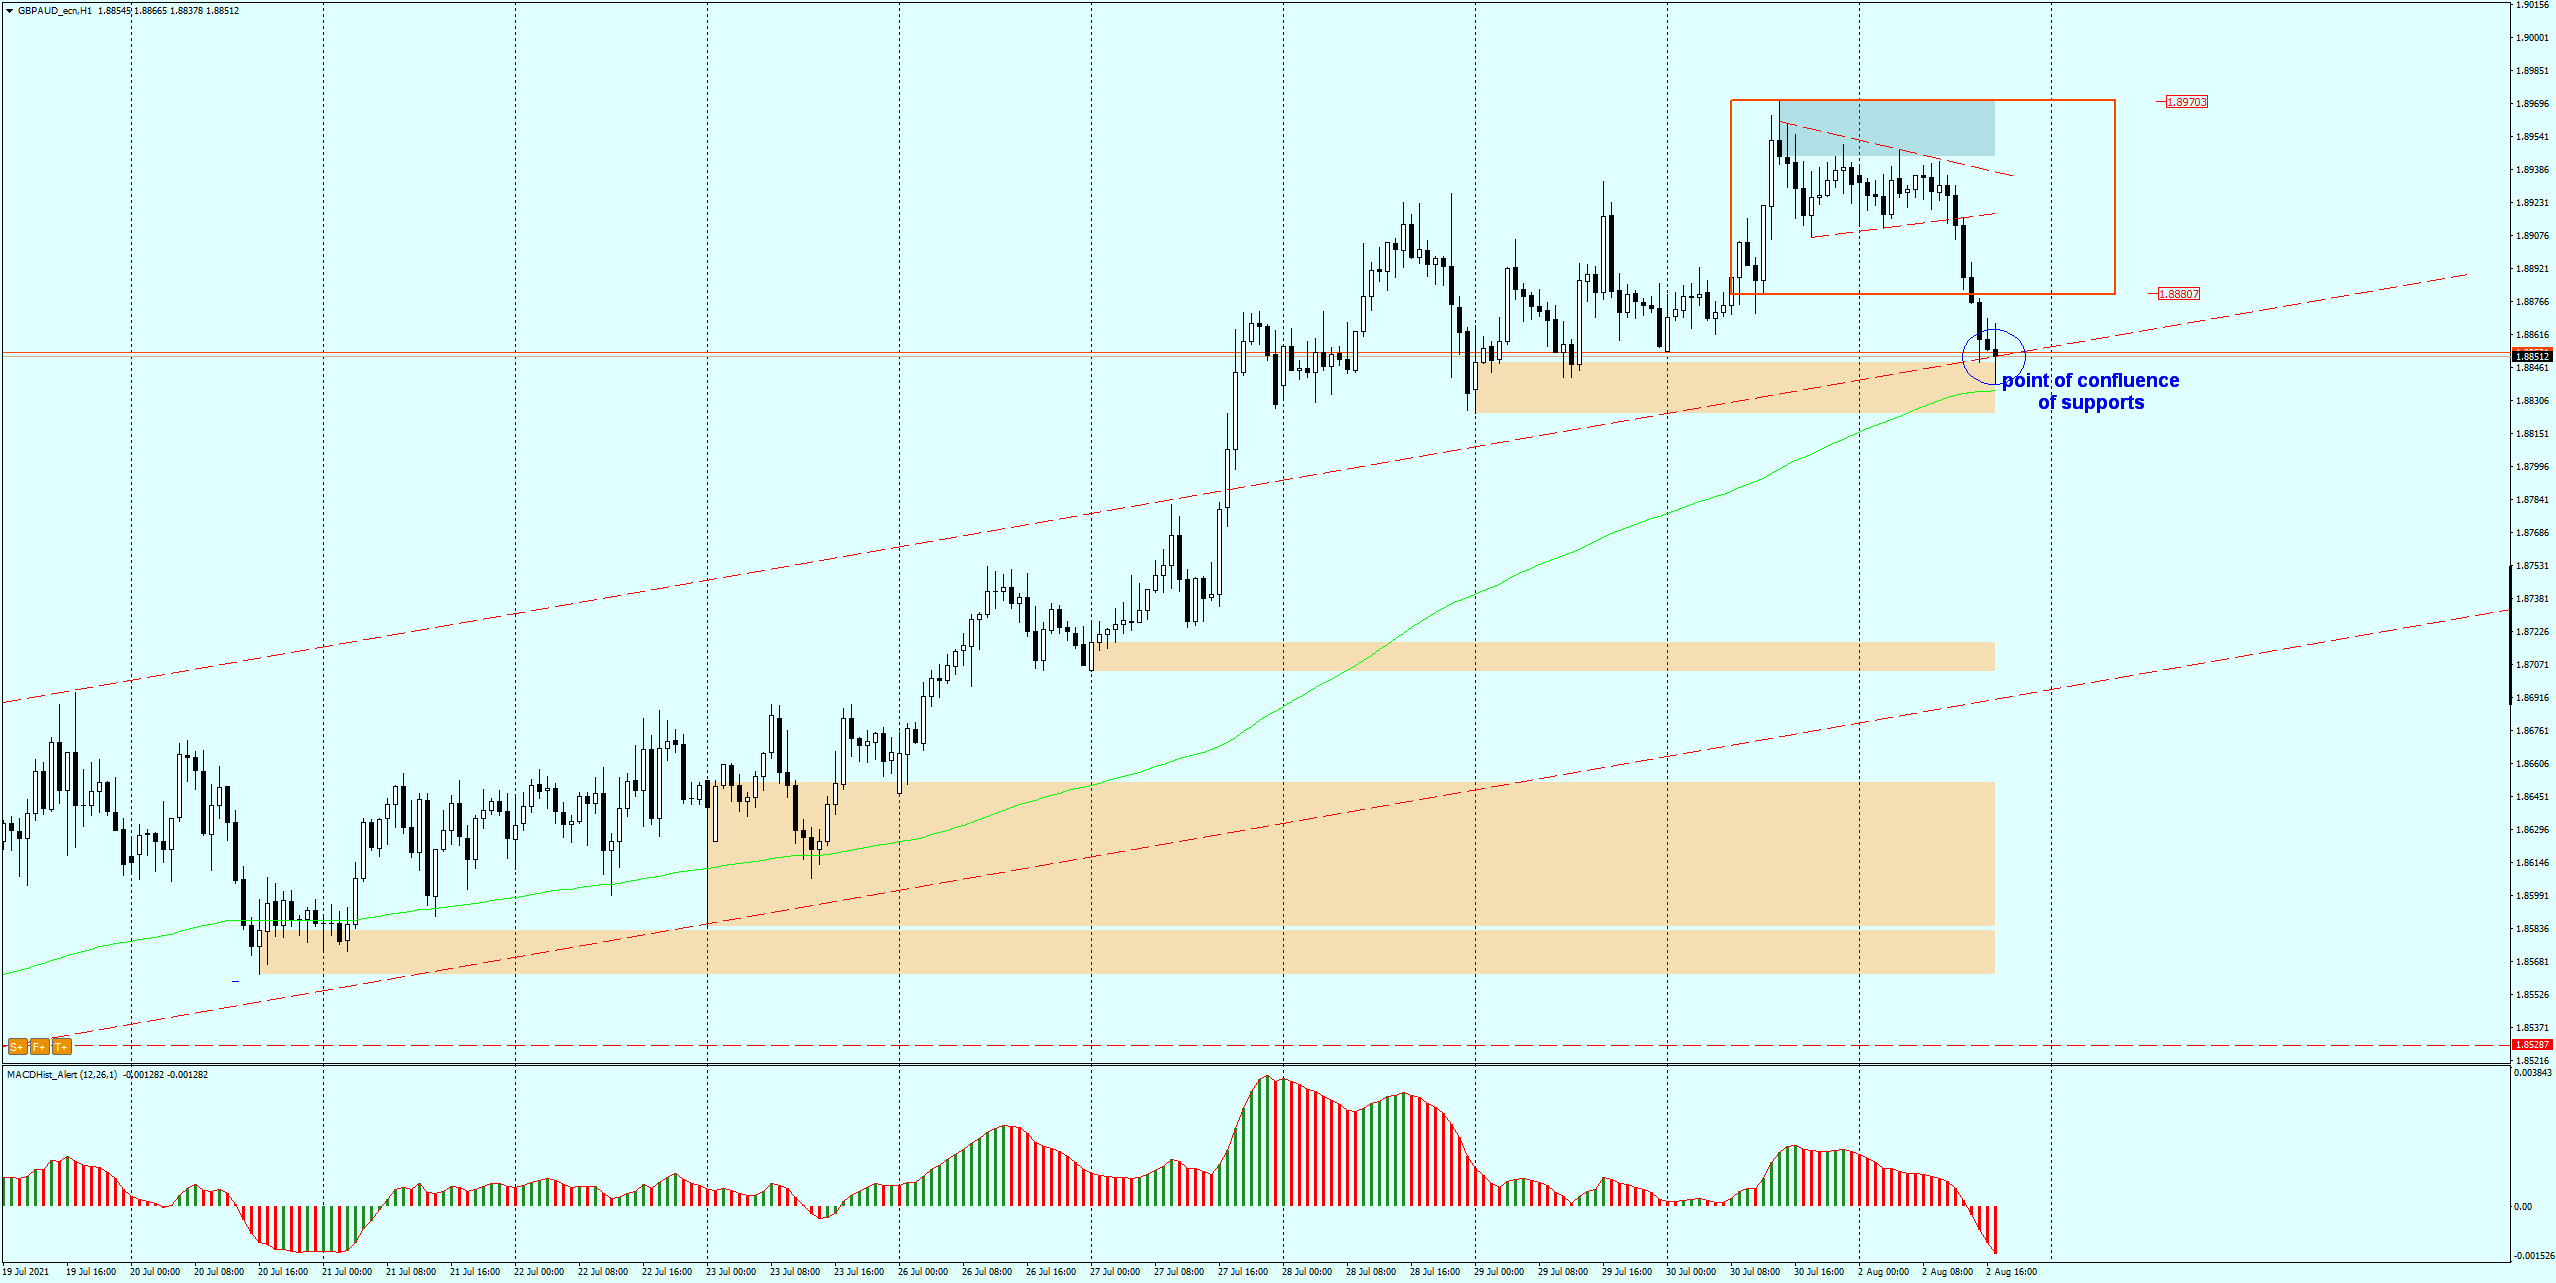
On the H1 chart the demand zone together with the resistance of the mentioned channel forms a point of confluence of support . If the price breaks through this level (1.8850), we may witness another series of declines to the next demand zone, starting at 1.8725.
It is also worth watching the daily chart where MACD is upward (green), but if it enters the downward phase – it would be a good support for the downward scenario.
Tuesday morning ( 5:30 GMT+1) we will know the RBA interest rates decision – it can have influence on AUD and this pair, so trade safely.
By the way, I invite you to a live trading session :
Tuesday 03.08 at 08:00 GMT+1. Free entry here: Live Trading
I recommend a description of the strategy used for this analysis:
ongoing analysis https://t.me/TradewithDargo
 In our Facebook group, which you can join anytime: https://www.facebook.com/groups/328412937935363/ you will find 5 simple strategies on which my trading is based. There, every day we post fresh analyses of currency pairs and commodities. You can also visit my channel where I post my trading ideas: https://t.me/TradewithDargo


 Review")


