Weekend is a good time to look at the weekly charts. The first week of February began with the breakout from the more than six-month consolidation in which GBPCHF quotes were moving from August.
- Weekly inside bar
- Daily bullish engulfing
- Possible upward movement of more than 300p
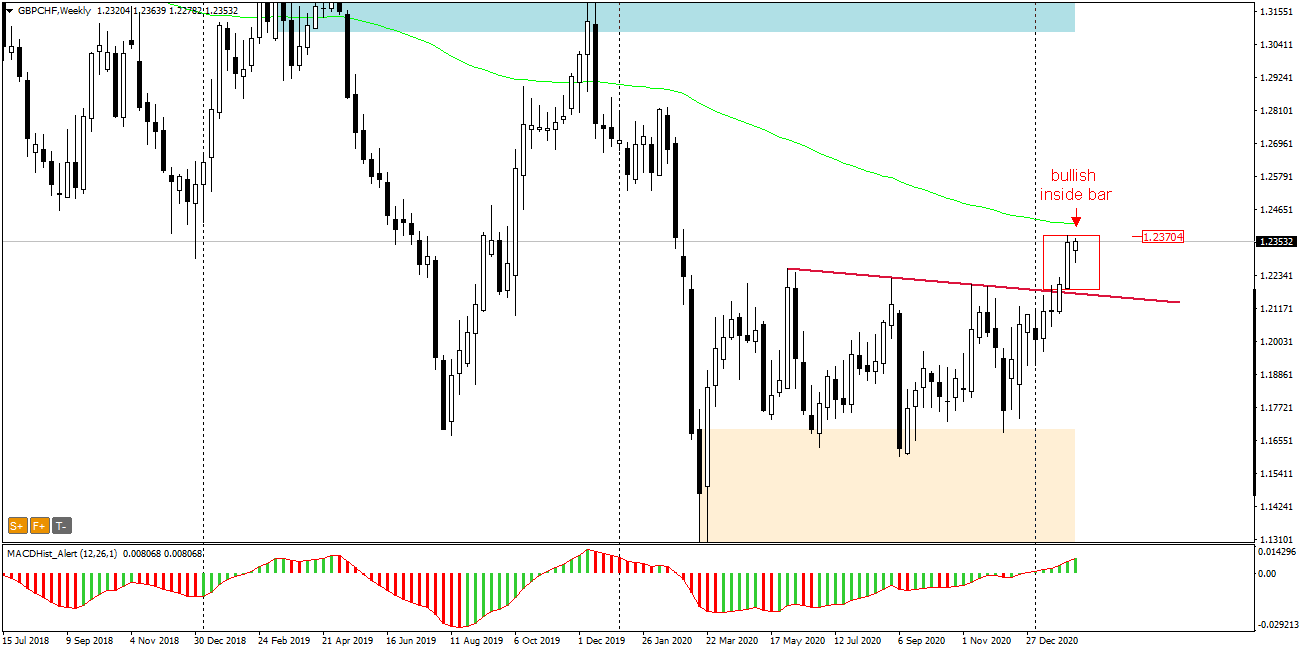
The quotations in the second week of February did not overcome the previous week’s range and formed an inside bar formation on the GBPCHF pair. What is noteworthy is that all last week the price moved in the upper half of the formation, (such inside bars usually are bullish), which usually suggests an upward breakout.
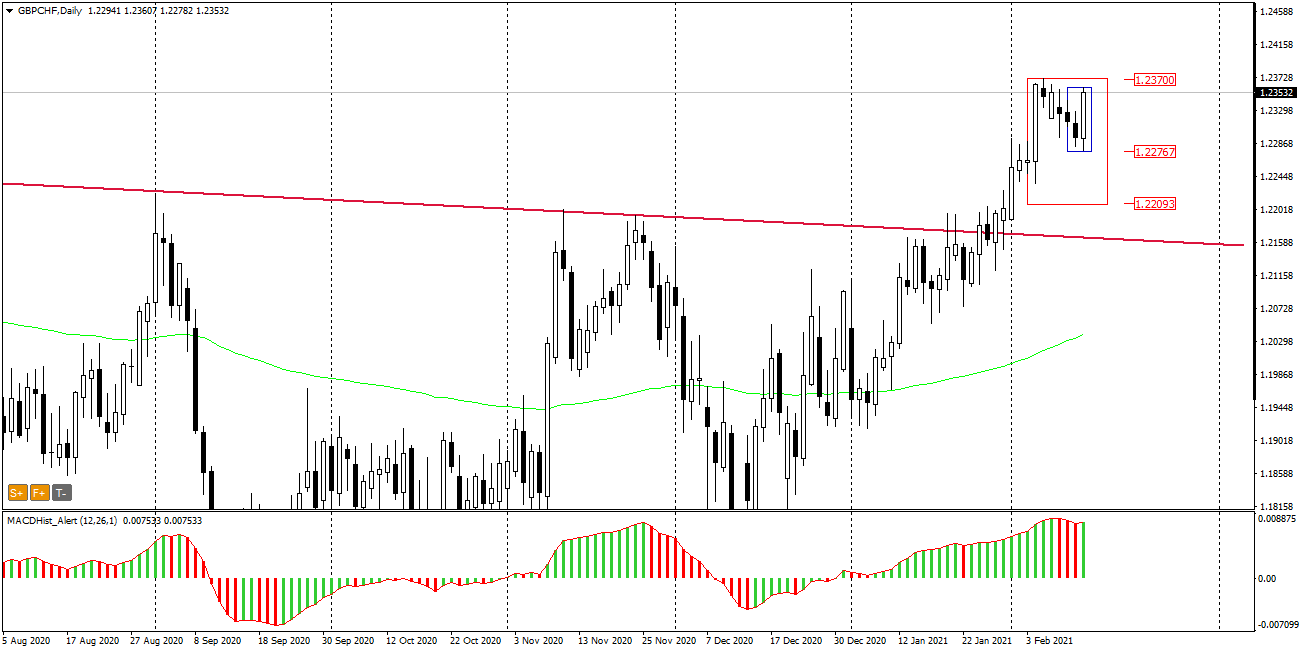
If we look at the daily chart D1, we can see that in the weekly inside bar (red rectangle) a bullish outside bar (blue rectangle) appeared.
This pattern indicates the dominance of buyers on this pair. Additional element supporting the upward scenario is MACD – oscillator after three trading bearish days returned to bullish phase.
The closest supply zone is located 300p above, which makes it worthwhile to pay attention to this pair in the coming sessions. The probability of growth will significantly decrease in case of the bottom breakout from the daily inside bar.
ongoing analysis https://t.me/TradewithDargo
 In our Facebook group, which you can join anytime: https://www.facebook.com/groups/328412937935363/ you will find 5 simple strategies on which my trading is based. There, every day we post fresh analyses of currency pairs and commodities. You can also visit my channel where I post my trading ideas: https://t.me/TradewithDargo


 Review")


