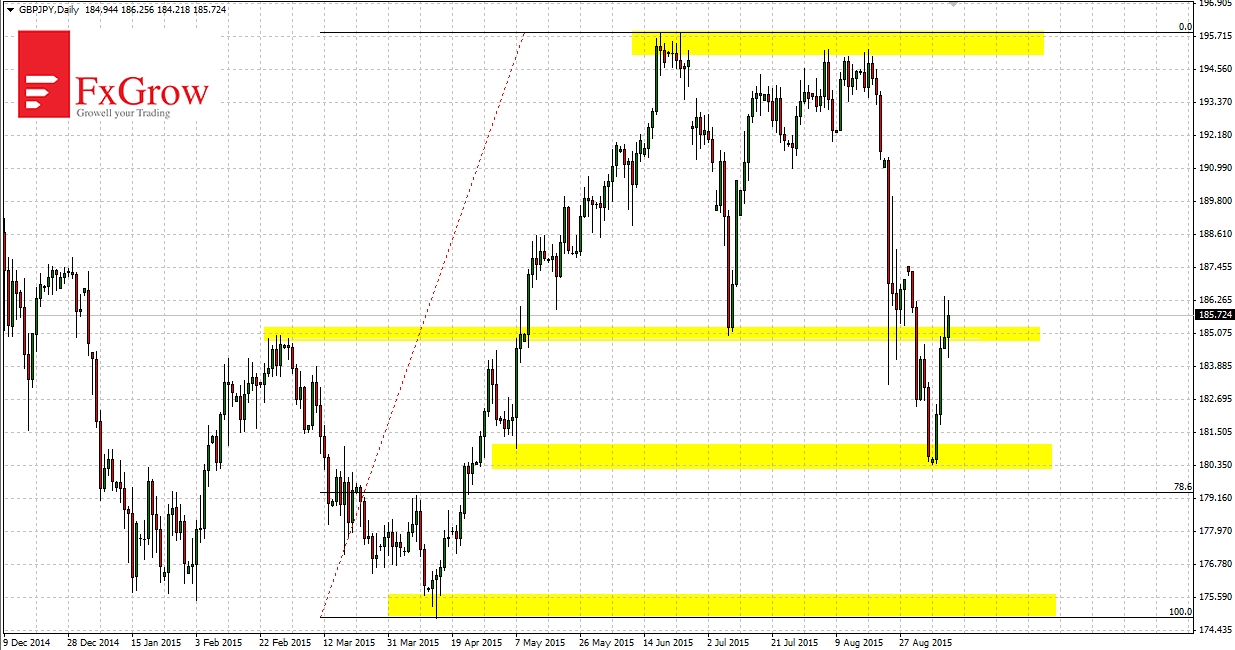
GBPJPY is moving in an upward trend since 2012. Last three months was a correction descent and the inability to reach a new high. Level 195.80 stopped move up and it is a historical resistance. Recent upward movement from April to June 2015 have been corrected for less than 78.6%. Rebound from support of 180.40 caused the move up which stopped at the first resistance 185.20. Break above that resistance will cause move to 195.00, where bulls will try to end current correction. Alternatively, if the GBPJPY break below support at the 180.40 price will fall to 175.00.
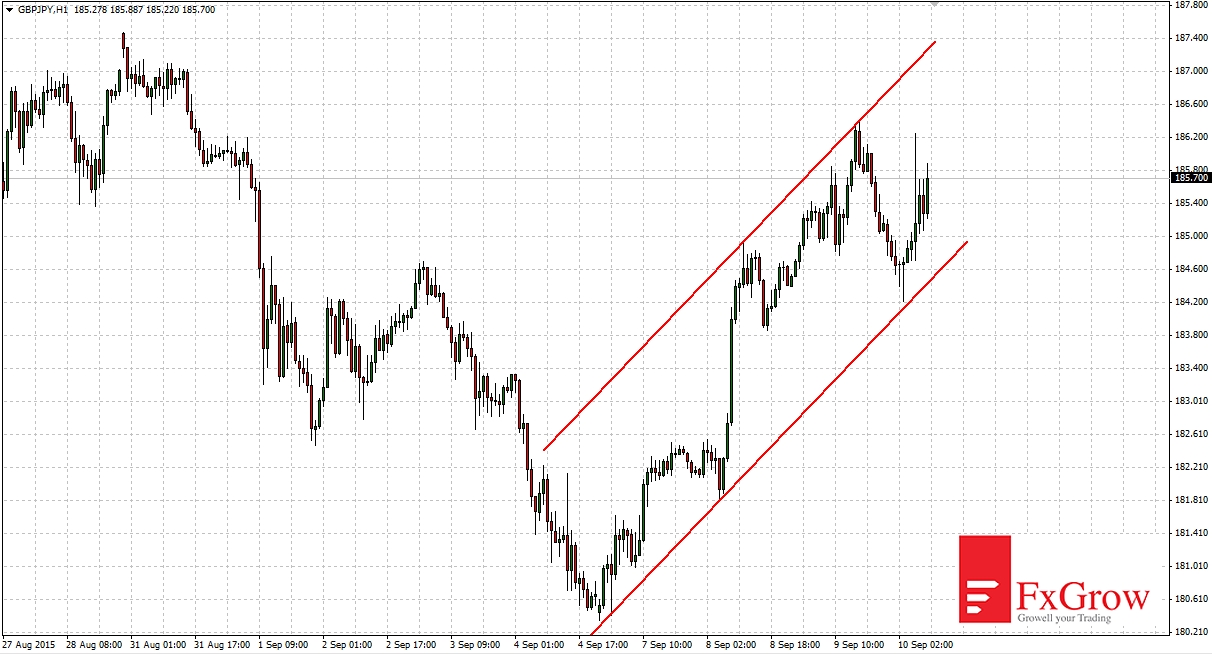
Time-frame H1
For a week GBPJPY moves in an upward channel. Currently, the lower limit of the channel is located at 184.50 and top of the channel 187.30. Breaking down the channel will signal that the price could soon retest the support at 180.40.


 Review")


