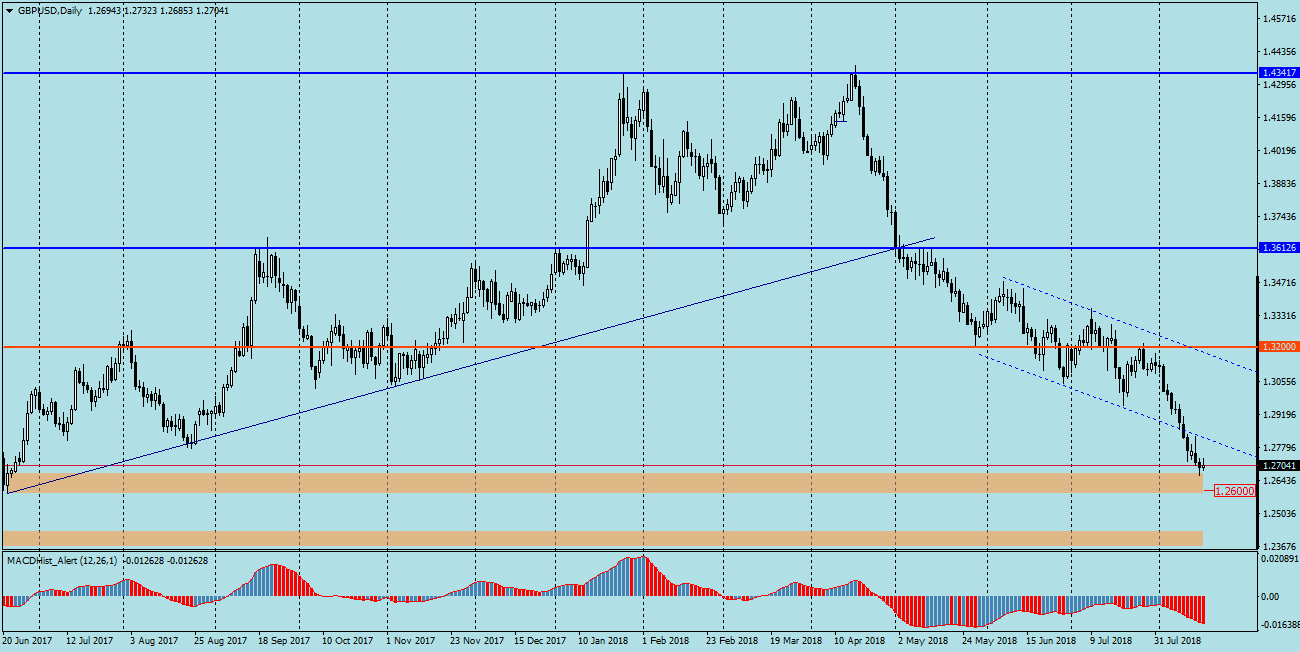
GBPUSD – Since April when the pair reached the maximum of this year at 1.4375, we see declines. Last week quotations left the descending channel thru the bottom and are still heading south. Yesterday, the pair reached the level of 1.2660 where there is a demand zone, just from it in June began last year rally which ended with setting the maximum mentioned at the beginning. There is a high probability that there will be a will to initiate a correction in this demand zone. It is worth waiting until today’s day candle is closed, because a good sign to buy may be setting minimum on MACD oscillator on the daily chart and the emergence of an upward divergence.
The upward divergence is already visible on the H4 chart, which may support the corrective scenario. The target of the correction may be the channel’s support, which has already been tested once from the bottom.


 Review")


