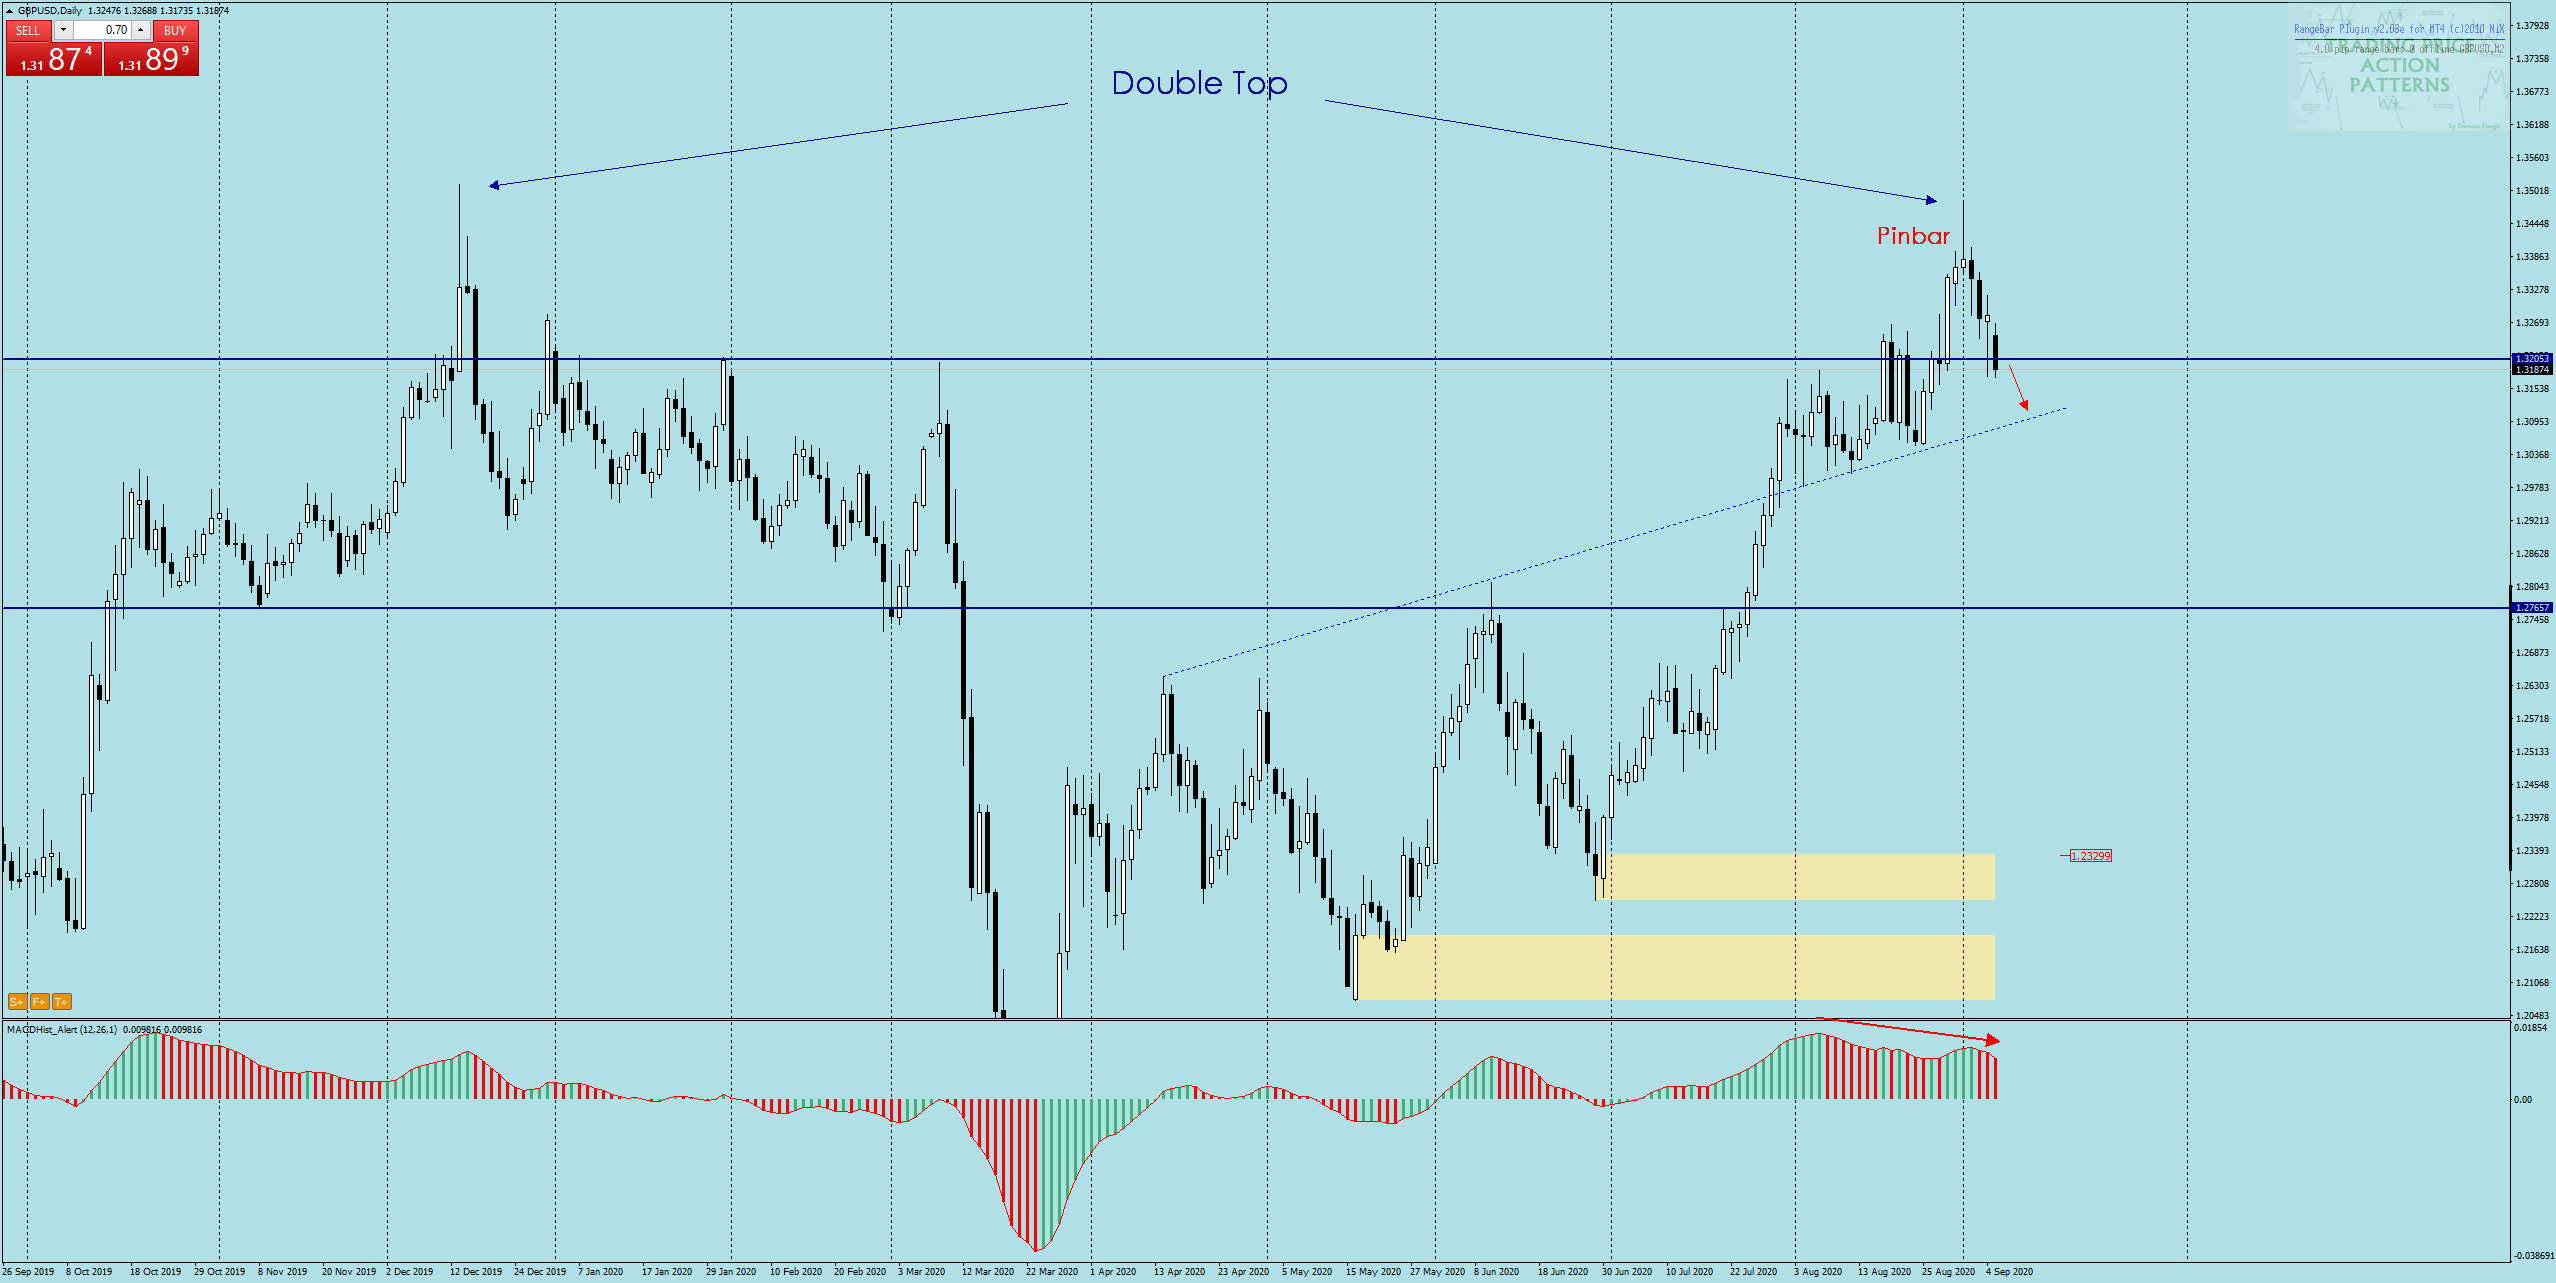
GBPUSD – the pair after intensive increases lasting from the end of March reached 1.3480. After setting the maximum of this year the price started to fall and the daily candle from 01.09 took the shape of a bearish pinbar. The next three days were a continuation of the declines.
When you look at the daily chart you will notice that the 2019 and 2020 peaks are at a similar level, which may be the beginning of the double peak formation. However, for it to happen, the price would have to reach 1.28. On the MACD the third day of the downward divergence.
Analysis on a regular basis https://t.me/TradewithDargo
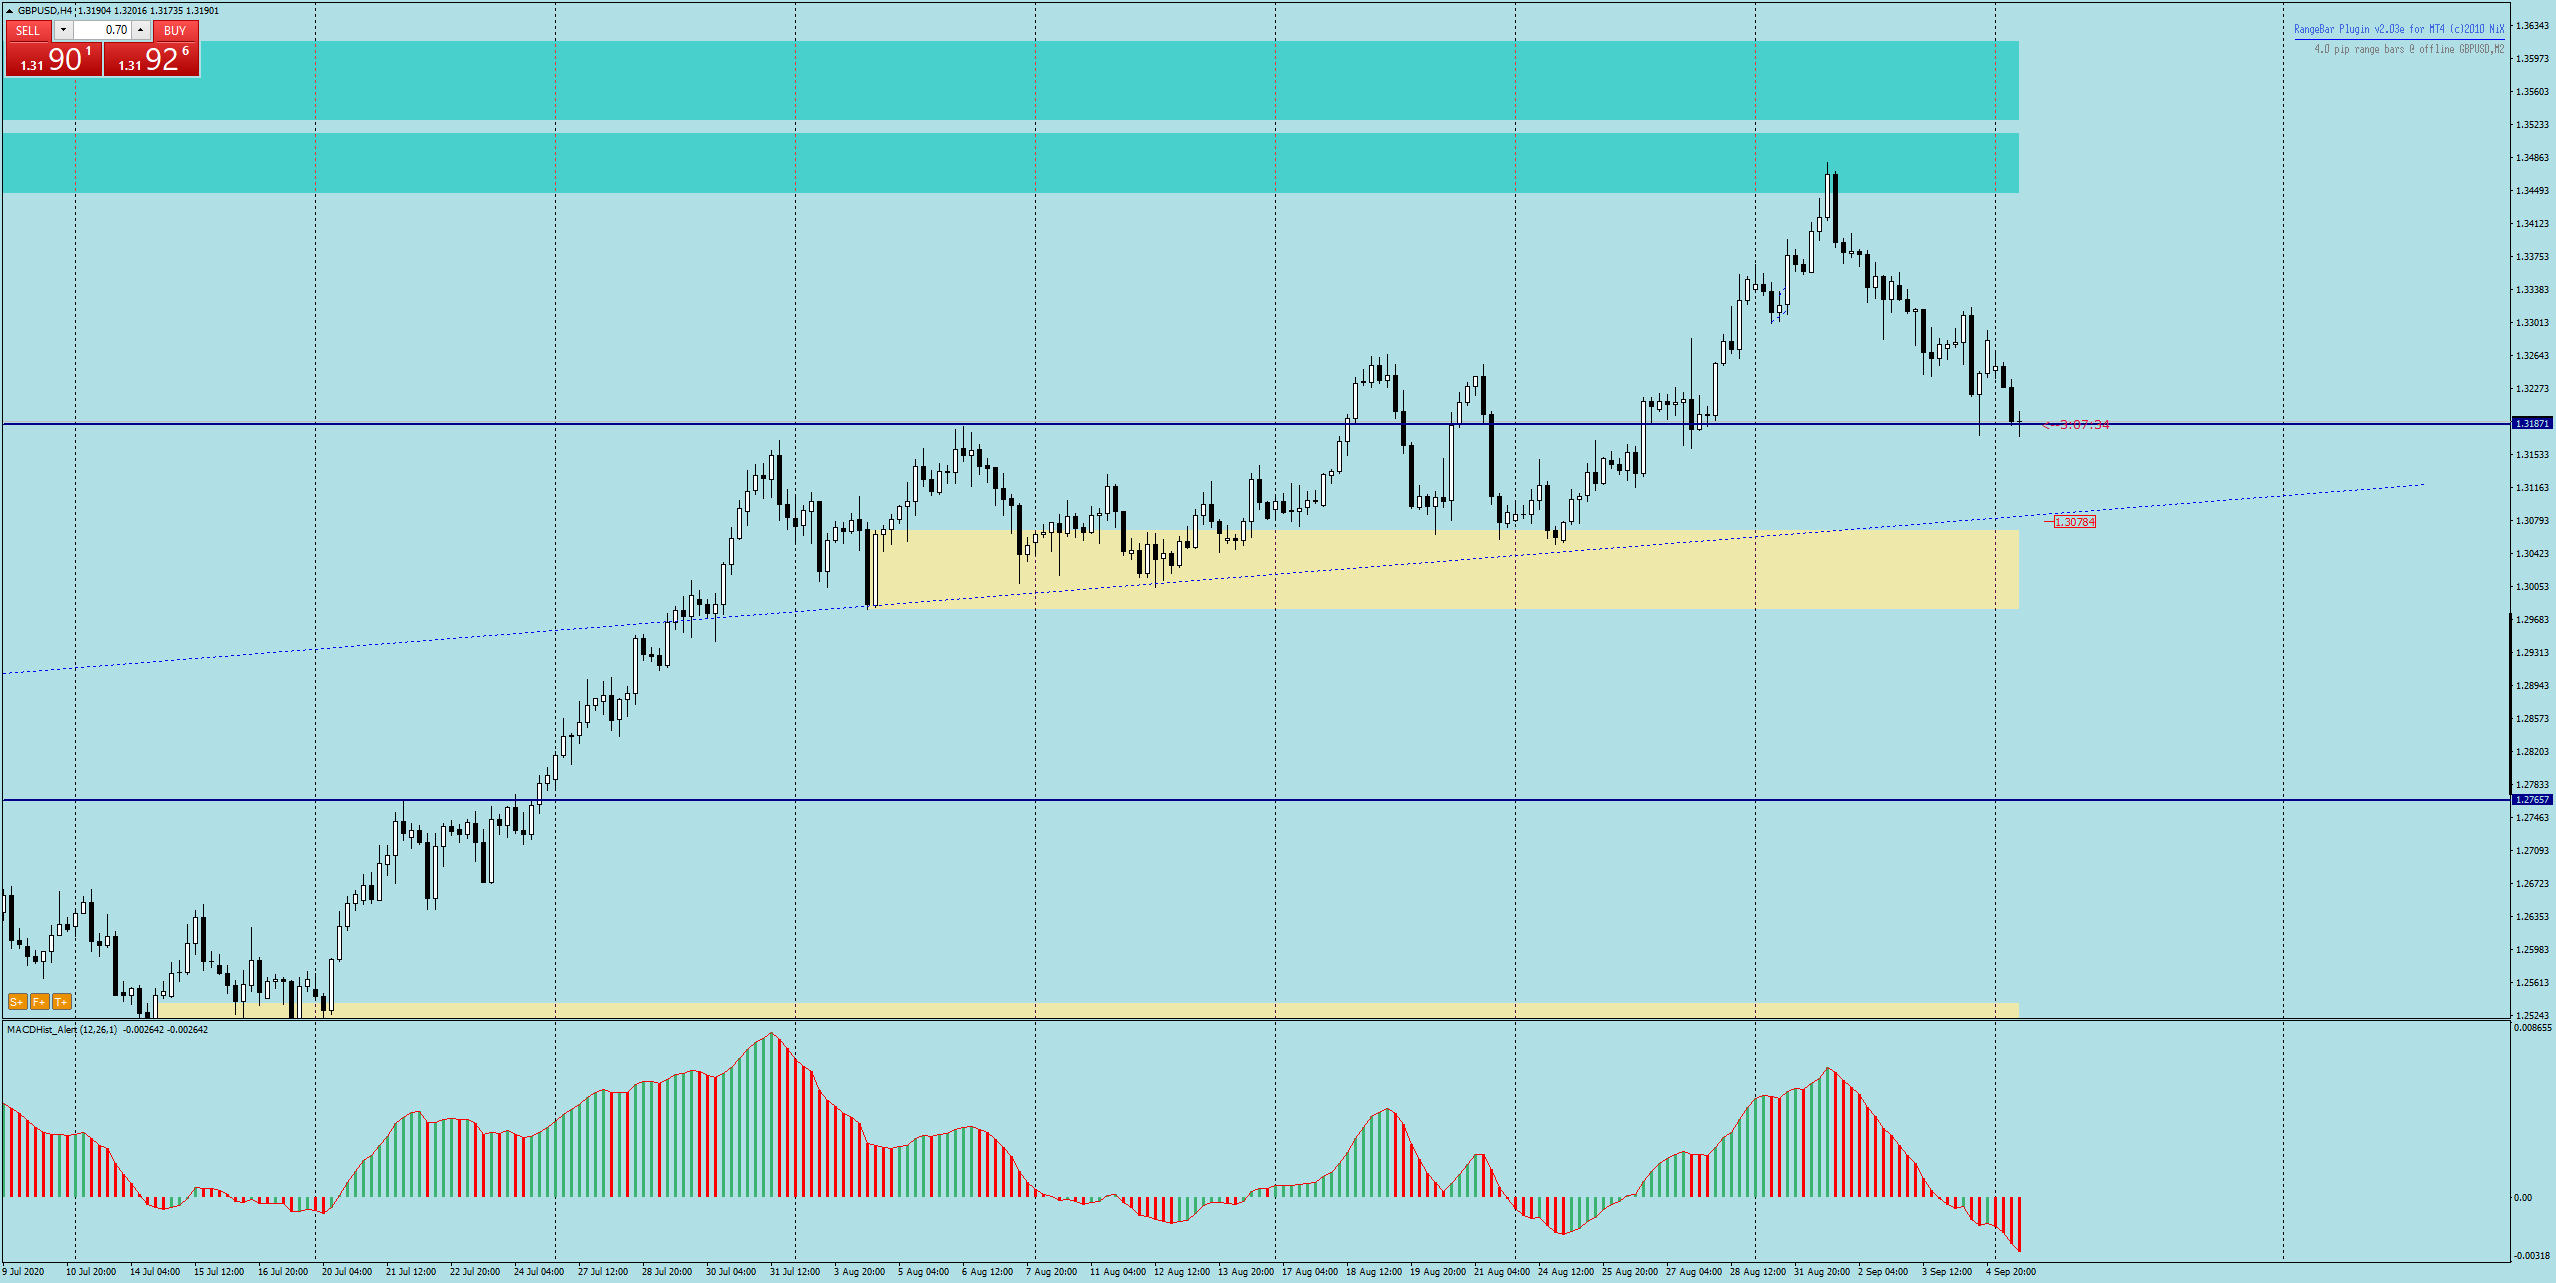
On H4 chart, however, we can define a closer target for sellers – it is a strong demand zone starting from 1.3080, and only if it is overcome can it lead to further declines.
The GBPUSD pair’s quotations this week will be affected by the news from the EU-UK talks starting tomorrow on the trade treaty to be in force from 01.01.2021. Therefore, caution should be needed and open orders should be secured by TP and SL in case of sudden changes in the mood of the pair.
I recommend :
- – Trading with PA+MACD, or how to increase the probability of winning
- – analysis on a regular basis https://t.me/TradewithDargo
 In our Facebook group, which you can join anytime: https://www.facebook.com/groups/328412937935363/ you will find 5 simple strategies on which my trading is based. There, every day we post fresh analyses of currency pairs and commodities. You can also visit my channel where I post my trading ideas: https://t.me/TradewithDargo


 Review")


