I wrote about the GBPUSD pair exactly a week ago, suspecting that a familiar Head and Shoulders formation had formed on the day chart. The poor data from the UK was systematically pushing the price southwards, but the neck line of the alleged H&S proved to be an effective support and the price returned to 1.3115.
From Monday to Friday – Live trading at 13:00 (London time) chat, analyse and trade with me: https://www.xm.com/live-player/basic
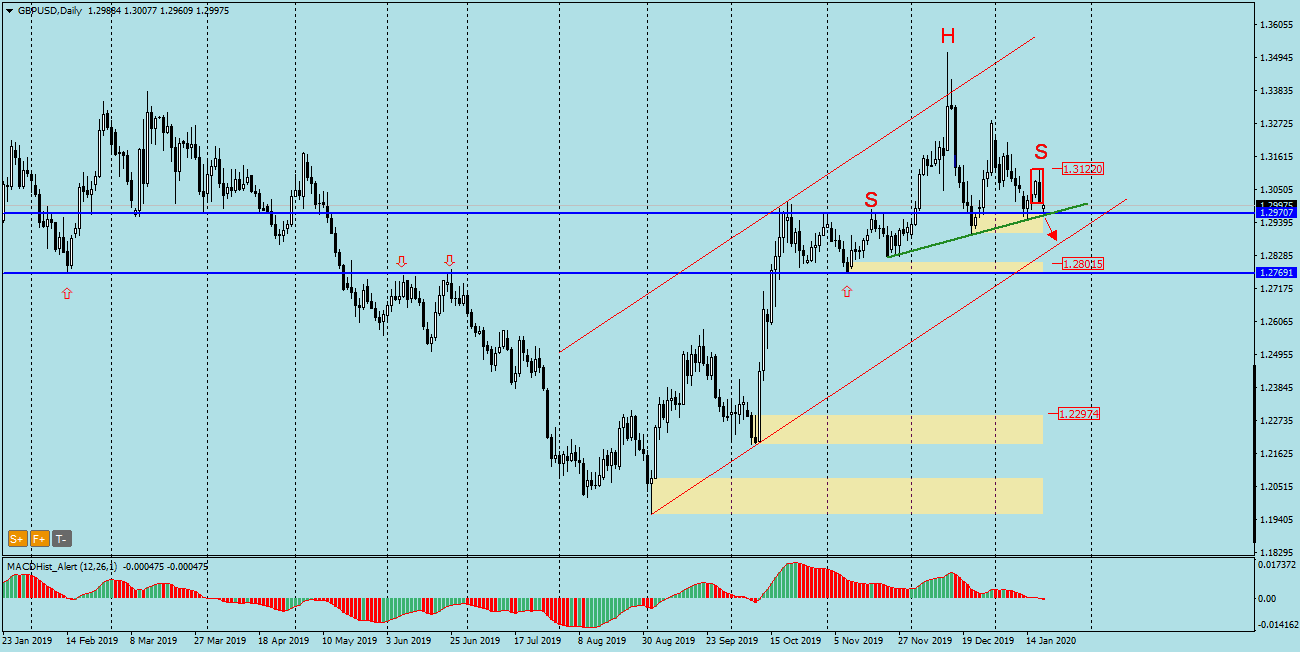
Friday’s session turned out to be a heavily declining one, its range completely covered Thursday’s and a candlestick pattern was formed the bearish engulfing (bearish outside bar). Today’s session started with the lower limit of this pattern and the price fell back to the neck line of the H&S.
This week we will see more data from the UK, including Tuesday’s Labour Market – Average Earnings, Unemployment and Friday’s PMI for industry and services. These will undoubtedly affect the position of the Bank of England. Next week on Thursday (30.01), BoE will announce its monetary policy, interest rates are expected to be cut by 25bpb, which will probably weaken GBP, and if not this week, it may lead the pair to the neck line referred above, next week.
The likely declines may stop at the support of the channel, which is currently at 1.2850. Another target may be a strong support/resistance level of 1.2770.
In our Facebook group, which you can join anytime: https://www.facebook.com/groups/328412937935363/ you will find 5 simple strategies on which my trading is based. There, every day we post fresh analyses of currency pairs and commodities


 Review")


