GOLD – this is the third time this month that the quotations of this precious metal attracted my attention.
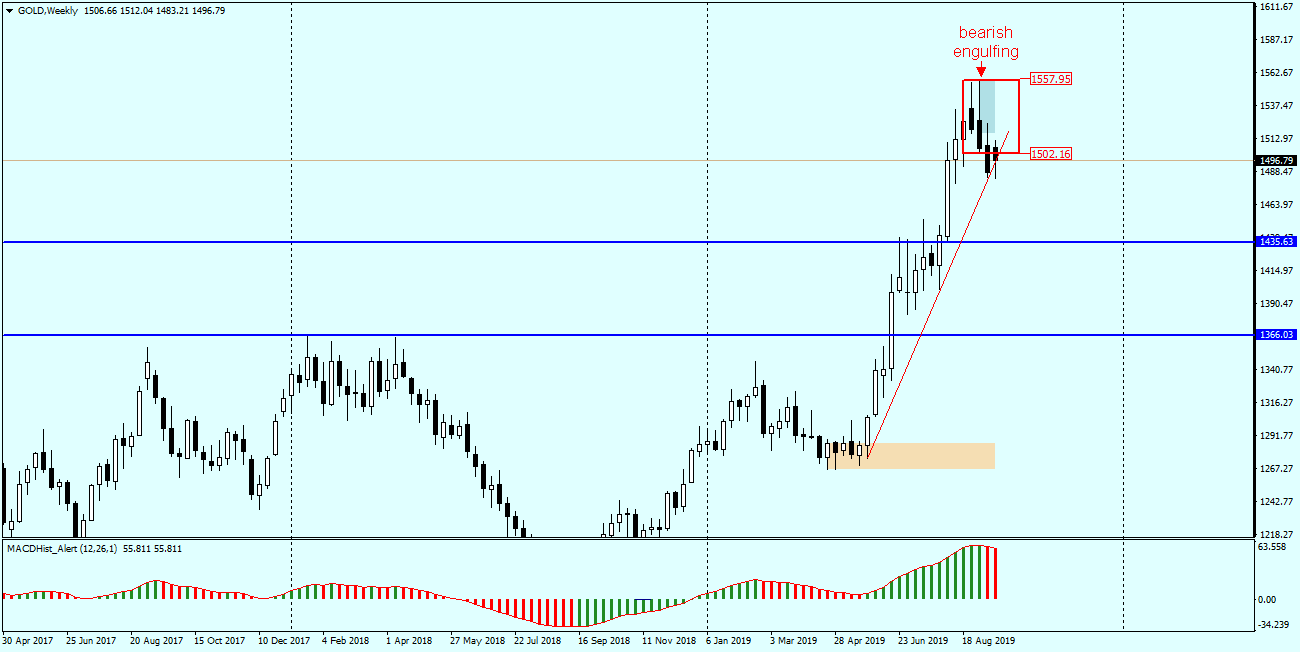
In Monday’s analysis I focused on the (red rectangle) which formed on the weekly chart, suggesting the continuation of falls.
Yesterday’s daily candle (the chart below) formed another bearish formation (blue rectangle).
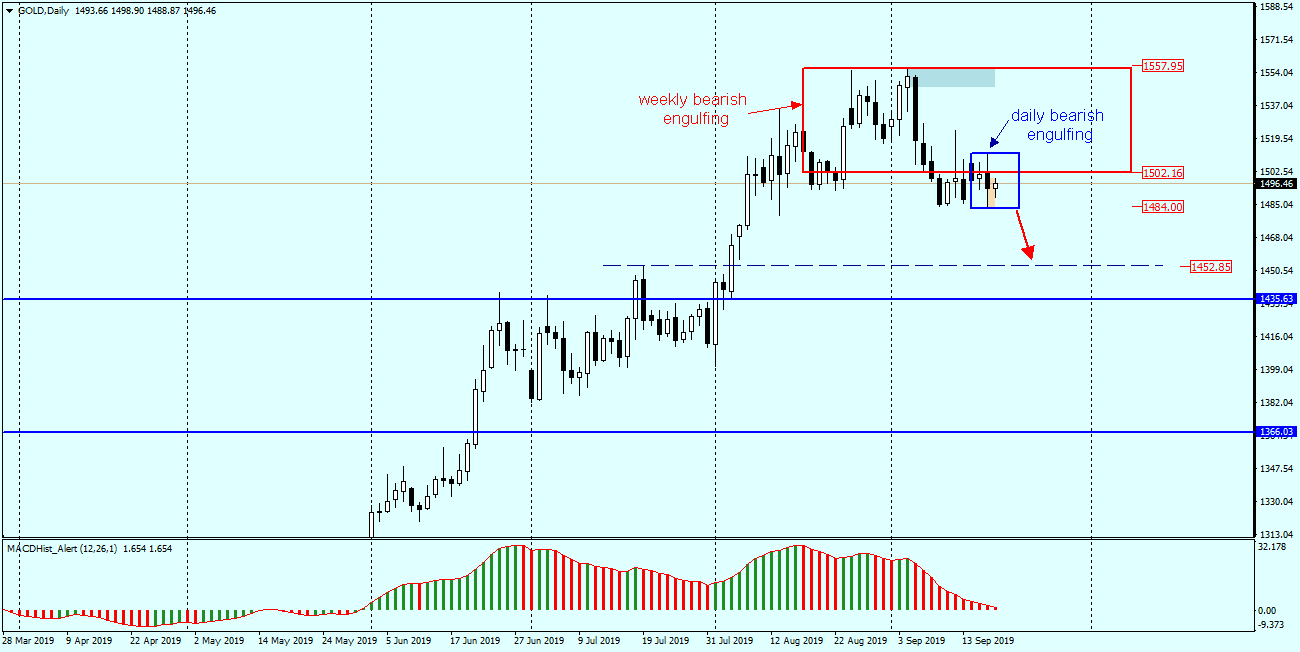
If the bottom of the formation is broken, we can expect quite dynamic falls to the nearest support level around 1453$/oz. The factor supporting the bearish scenario is the decreasing MACD on both the weekly and daily charts and the effective breaking of the upward trend line (on the weekly chart – red line).
 In our Facebook group, which you can join anytime: https://www.facebook.com/groups/328412937935363/ you will find 5 simple strategies on which my trading is based. There, every day we post fresh analyses of currency pairs and commodities


 Review")


