GOLD – Gold has been moving for 5 weeks in consolidation, which took the shape of a symmetrical triangle. The formation of a symmetrical triangle is bilateral, which means that the probability of breaking in either direction is the same.
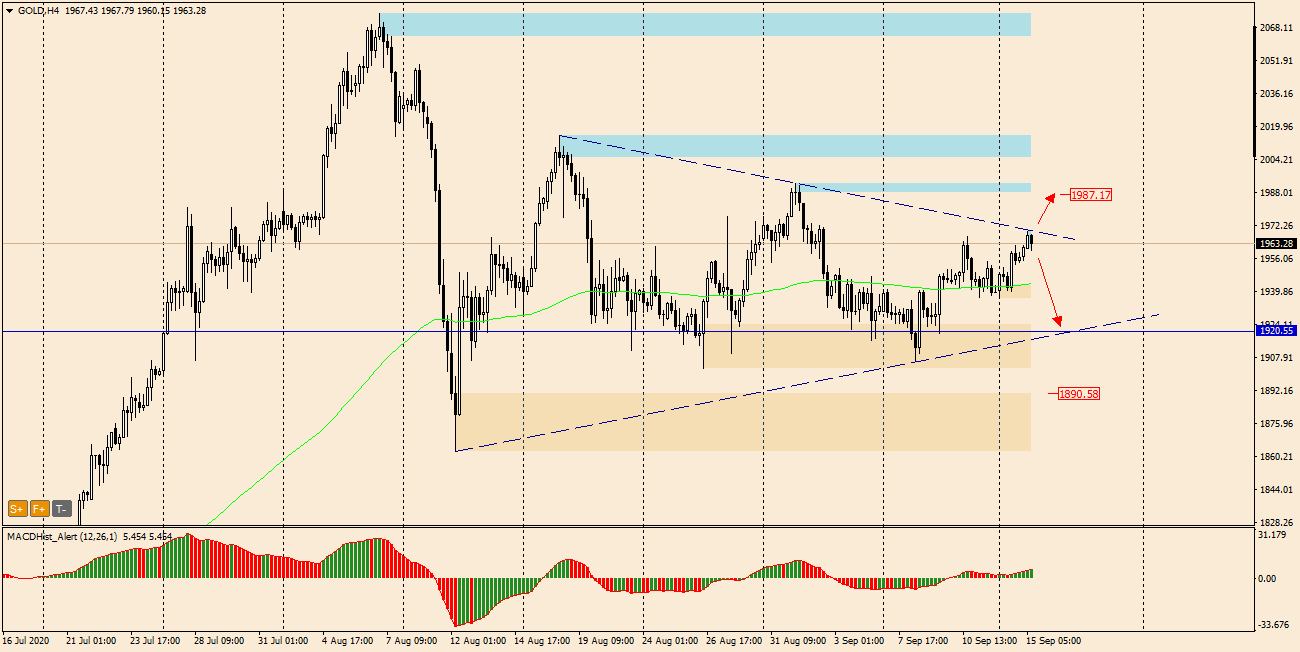
Currently, the price has reached the resistance of the triangle and has slightly turned south. Is this a signal to declines?
https://t.me/TradewithDargo
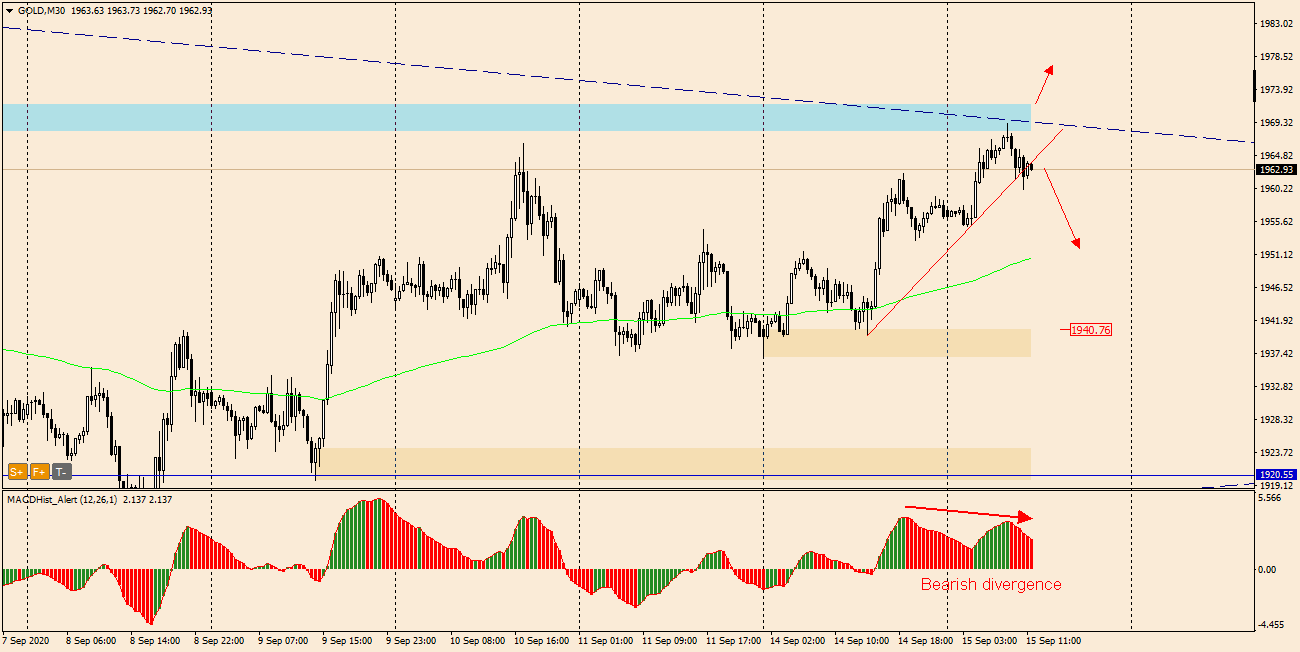
Looking at the M30 chart you will notice that the price of gold fell below the local trend line. On the MACD there is downward divergence.
Divergences on the M30 are not a strong signal for declines, but for the next few 30-minute candles we can expect bearish sentiment, especially as the H1 oscillator is also in a declining phase.
The best confirmation of this scenario would be a maximum on MACD on TF H4. If such a signal appears, a short can be considered. The goal could be a demand zone of 1940 $/oz.
It cannot be ruled out that a growth scenario would occur after overcoming the resistance of the triangle. Then the goal would be a supply zone of 1985 $/oz
Tomorrow the FOMC meeting will take place. The decisions that will be made there may have a big impact on financial instruments, including gold prices. Therefore, this event should be taken into account when planning to open an order.
I recommend :
- – Trading with PA+MACD, or how to increase the probability of winning
- – analysis on a regular basis https://t.me/TradewithDargo
 In our Facebook group, which you can join anytime: https://www.facebook.com/groups/328412937935363/ you will find 5 simple strategies on which my trading is based. There, every day we post fresh analyses of currency pairs and commodities. You can also visit my channel where I post my trading ideas: https://t.me/TradewithDargo


 Review")


