Ichimoku is a trading strategy created by Japanese journalist Goichi Hosoda who labeled his own articles with a nick name – Ichimoku Sanjin. Hosoda elaborate his strategy before II WW, and has been testing it for over 30 next years. Until 1969 Hosoda published a book, in which he described his author’s strategy. On the left side of screen is one of the few photos of Hosoda.
What is Ichimoku?
Ichimoku is a trend following trading strategy, which can show with a great probablity if the price is currently trending, or not. This system also brings you precise point of entering the market and different ways of leaving it. It is not the strategy for catching lows and highs for sure, but it will help you to generate stable profits while giving necessary time to manage your capital and avoid needless stress often found on the market.
Strategy described in such way may seem to be a Holy Grail in trading – but unfortunately it is not. Just like in any other trading strategy, you can find here a false signal and the price may suddenly turn around moving in completely different direction. That is why you must master the technique of premature closing opened positions to cut off needless losses. This strategy is created for real trading which takes into account all market possibilities. But most important thing is Ichimoku Kinko Hyo allow you to generate profits during long period of time.
Ichimoku is very popular among japanese traders, and even it works pretty well with any type of financial instrument, you need to remember that it was created especially for Japanese yen. Give it a try with real trading on GBP/JPY, EUR/JPY or USD/JPY using original settings.
Basics of Ichimoku strategy
Ichimoku chart is made by five basic lines. Unlike standard moving averages based on closing prices, Ichimoku take into account historical lows and highs. Because of that, Ichimoku strategy is much more elastic, and it responds to market changes faster. You can try it by yourself. Just put one of the Ichimoku lines on the chart, and then compare it with a simple moving average with same settings.
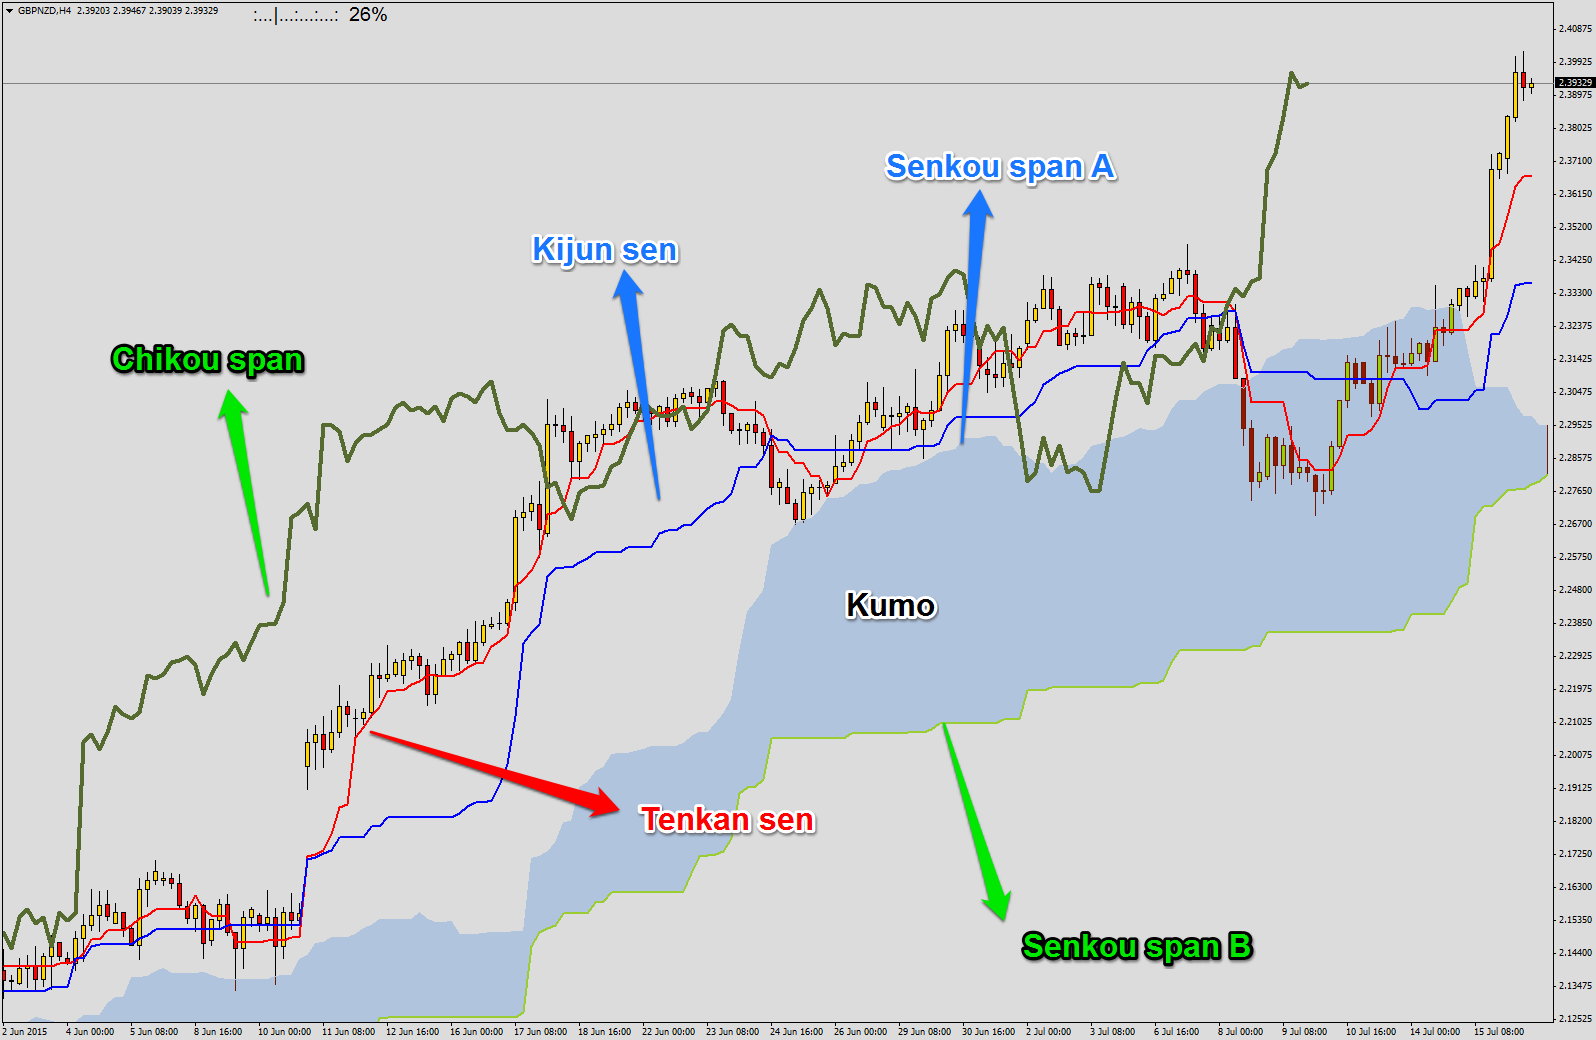
Basic Ichimoku lines:
- Tenkan Sen (turning line) – red line,
- Kijun Sen (standard line) – blue line,
- Chikou Span (lagging line) – green line,
- Senkou Span A (first leading line) – the upper limit of growth cloud (blue), or lower limit of downward cloud (green)
- Senkou Span B (second leading line) – the lower limit of growth cloud, or upper limit of downward cloud
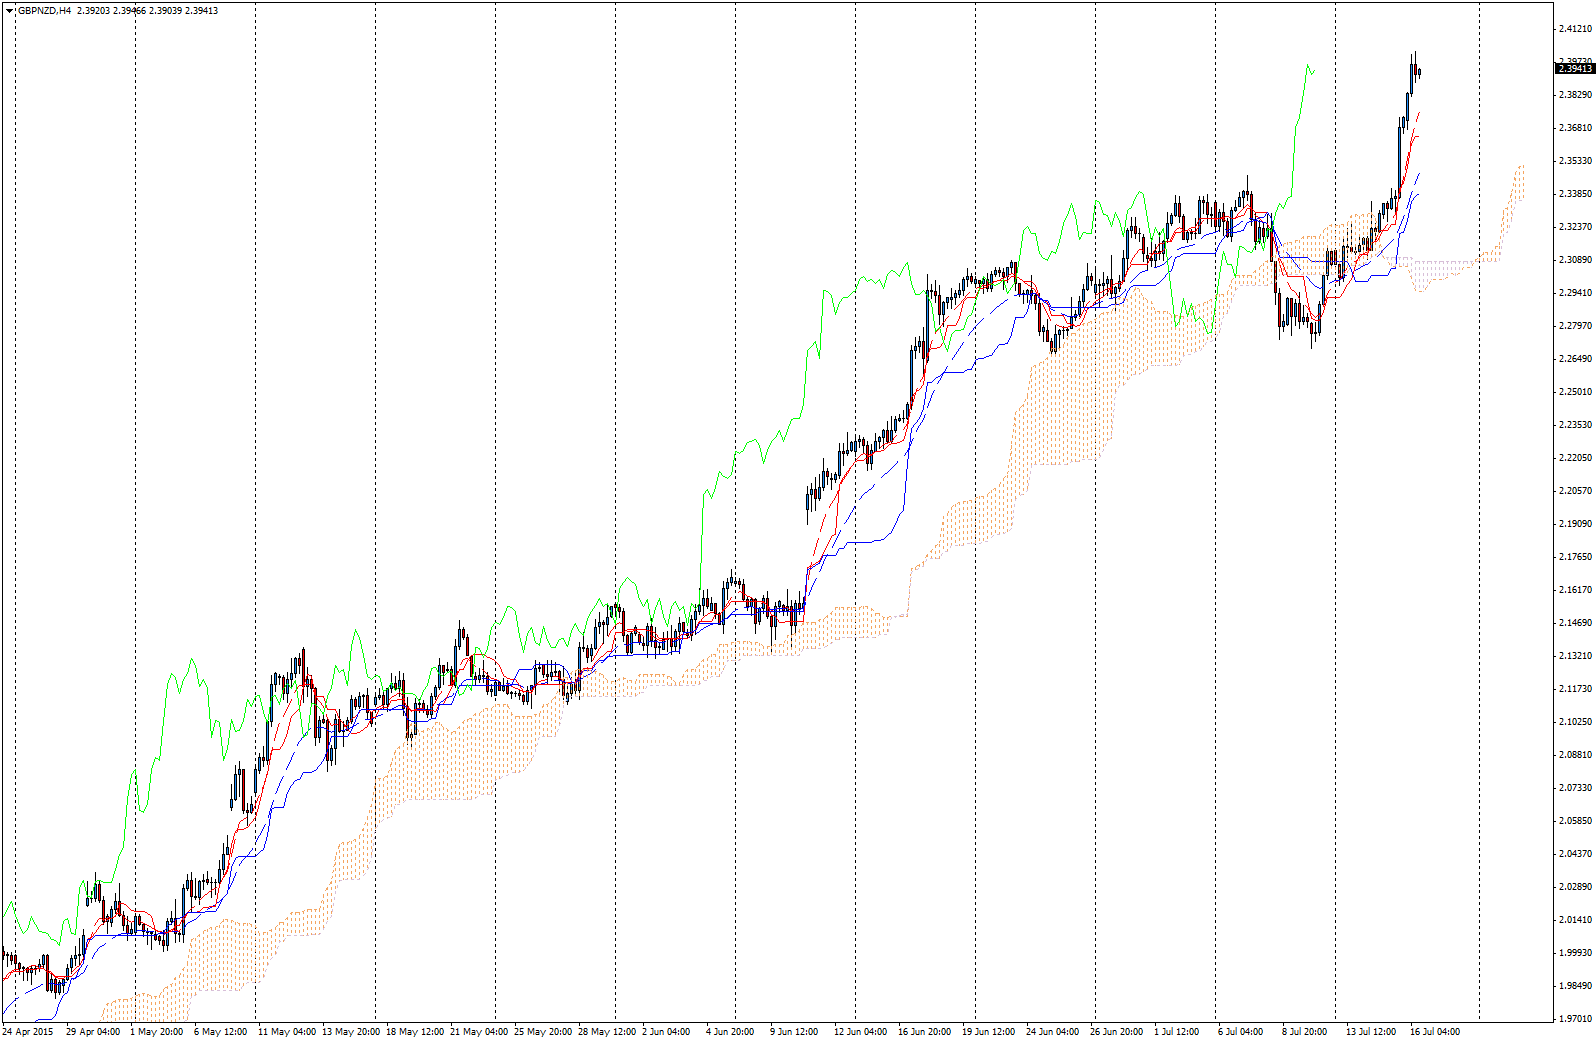
Cloud mentioned above (called Kumo in Japanese) is an area between two leading lines – Senkou Span A and Senkou Span B. Depending on the direction of cloud (moving upward or downward) it will take on different colour. Standard Ichimoku indicator available on every MT4 station is presented on the left side of screen. You can see, that this build in indicator is pretty illegible. That is why Comparic recommends using Ichimoku indicator available here (you can also download BarChart indicator which measures time left to create the candle). This one is much more clear, and all of our analysis are based on this specific indicator.
Signals created by Ichimoku
Ichimoku Kinko Hyo strategy can give you to different types of trading signals. First one is based on intersecting lines Kijun and Tenkan, and second based on price piercing through cloud. All of signals are listed below:
- Tenkan sen crossing downward Kijun sen under the cloud – weak buy signal,
- Tenkan sen crossing downward Kijun sen in the cloud – neutral buy signal,
- Tenkan sen crossing downward Kijun sen above the cloud – strong buy signal,
- Tenkan sen crossing upward Kijun sen above the cloud – weak sell signal,
- Tenkan sen crossing upward Kijun sen in the cloud – neutral sell signal,
- Tenkan sen crossing upward Kijun sen under the cloud – strong sell signal
Signals based on the price leaving the cloud:
- Candle closed above the cloud – buy signal (the more dynamic move the better)
- Candle closed under the cloud – sell signal (the more dynamic move the better)

To obtain the best effect, try to use both types of signal. Number of investment opportunities would reduce, but signals are much more accurate. Also, add another type of technical analysis, (for example Price Action) to create a trustworthy tool which will help you to realise profits with minimum risk.
Additional conditions for trading using Ichimoku:
- Use high intervals (H4 and higher),
- If you want to invest on lower interval, you have to confirm the trend on interval at least four times higher (for example, you would like to use M15 charts for trading, so to do so, you need to check the trend on H1 chart using Ichimoku),
- Set your Take profit near important support/resistance zones designated on weekly or monthly chart. Some of your trades will be closed near daily support/resistance zone.
- In the case of appearing new, counter- signal, position is also closed,
- Recommended risk to reward 3:1
Check our Ichimoku trading journal where you can find analysis based on above described strategy!


 Review")


