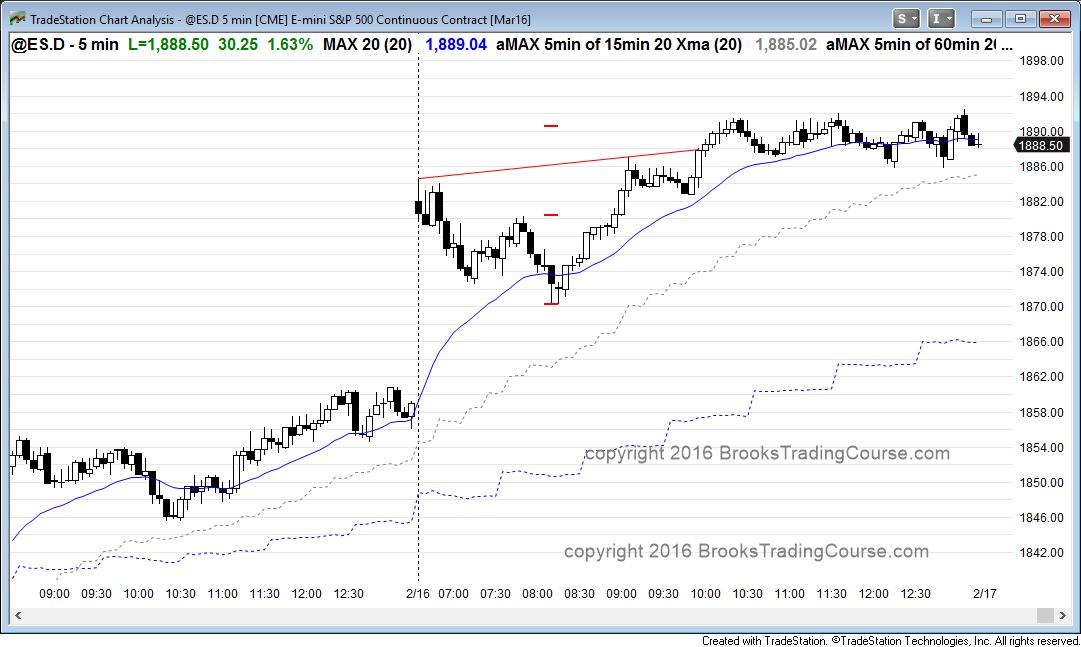
The Emini opened with a big gap up, but had 2 strong bear bars followed by a bull bar. The gap up made the Emini overbought, and the strong bear bars were a sign that traders were willing to sell. This increased the chances of mostly sideways to down trading for a couple of hours until the Emini gets closer to the moving average. If the bears are able to create a double top or a strong bear reversal with follow-through, traders will look for a swing trade down to the moving average.
These 2 initial bear bars make traders hesitant to buy this far above the moving average. If the bulls are able to create at least a couple strong bull trend bars, traders will buy. Otherwise, they will wait for a high 2 or wedge bull flag closer to the moving average.
Pre-Open Market Analysis
S&P 500 Emini: Learn how to trade a trend reversal
The rally up last week is giving online day traders a chance to Learn how to trade a trend reversal in the Emini. The Emini rallied strongly for 2 days and is back to the middle of the 5 week trading range. It is testing the moving average on the daily chart. Last week’s weekly chart formed a reversal bar candlestick pattern at the bottom of a 2 year trading range, but it was a doji and had a bear body. That is a weak buy signal. The Emini is up 20 points in the Globex market, just below last week’s high. If it trades above last week’s high today, it would trigger a buy signal on the weekly chart.
The bulls are trying to create a reversal up from the bottom of the 2 year trading range, but their attempt so far has been week. That reduces the chances for their success. There is still a 60% chance that this price action on the daily and weekly charts will be followed by a breakout below the January low. In the absence of a strong buy signal bar and strong entry bars on those charts, the bulls then need a strong reversal up, which they have yet to create.
Thursday’s bull reversal on the 5 minute chart was moderately strong, but it lacked consecutive big bull trend bars and it had many big bear bars. This reduces the probability that it will lead to a bull trend, and it increases the chance that it will be a bull leg in the 2 month trading range. Although Friday was in a flatter bull channel, which increases the chances of a trading range soon, it was also a small pullback bull trend, which is a subtle form of a strong bull trend.
Today will probably gap above the Friday’s bull channel, and the gap might become a measuring gap. Since the rally was about 60 points, a measured move up would test the February 4 high around 1920, and possibly the February 1 high of 1940. At the moment, there is a 50% chance of the Emini getting above that high, which was the 50% pullback from the January bear trend. If the bulls can get strongly above it, they would again have a 50% chance or anew all-time high before a strong breakout below the January low.
The momentum up and the context were good enough last week to make the odds favor sideways to up price action for the next couple of weeks. There are 2 weeks left to the month, and the bulls would like the candlestick pattern on the monthly chart to have a bull body and form a micro double bottom with January and a double bottom with August. The bears always want the opposite.
Today’s gap up will probably be big, and it is within a trading range on the daily chart. This increases the chances that the Emini will go sideways for the 1st 2 hours, even if it has an initial trend up or down for the first 30 minutes. Once it gets near the moving average, traders will decide whether it will resume up or reverse down. If it does reverse down, the odds are that it will form a higher low on the 60 minute chart, and then have a 2nd leg up to test the February high at around 1940 by the end of the month. Less likely, the selloff will relentlessly fall below the January low, and this brief rally will be the 2nd high of a lower high double top with the February 1 lower high.
Forex: Best trading strategies
On Wednesday last week, I wrote that the 60 minute EURUSD candlestick pattern was a wedge top and that it would probably have a couple of legs down to the bottom of the wedge at around 1.1100. It has had one leg down so far and it has been sideways for about 24 hours. The odds favor sellers above on the 1st rally and then a 2nd leg down on the 60 minute chart.
If the bulls are able to begin a rally today or tomorrow, it will probably fail at around a 50% pullback to around 1.1250 and form a lower high, and then have a 2nd leg down. The bears would see this as the right shoulder of a head and shoulders top. A measured move down would be back into the 2 month trading range that ended with the February 3 bull breakout.
While it is possible that the 2 day selloff simply continues down, the selloff has been in a very tight bear channel on the 60 minute chart, which is unsustainable and therefore a type of sell climax. This means that a bounce staring today or tomorrow is more likely. The selloff has been strong enough to make it likely that there will be sellers above and at least a small 2nd leg down.The range of the past 24 hours of trading has been tight.
Most day traders should wait for bigger swings before trading, but aggressive day traders are using wide stops and scaling in, looking for 10 – 20 pips scalps. Many are entering with limit orders, selling above highs and buying below lows within the tight range.
Swing traders are holding short with a stop above last week’s high, betting that the odds favor a 2nd leg down. Others will wait to sell a rally to what they believe will be a lower high.
Summary of today’s S&P Emini futures price action and what to expect tomorrow
The Emini rally is continuing and the Emini will probably be sideways to up for the next 2 weeks after the reversal up on the weekly chart. The 60 minute chart has been in a tight channel for about 20 bars, and that is unsustainable and therefore climactic. This increases the chances of a pullback tomorrow, but it will probably be bought for at least one more leg up.
See the weekly update for a discussion of the price action on the weekly candlestick chart and for what to expect going into next week.


 Review")


