![]()
![]() From Investor to Scalper – series of studies created in cooperation with broker BDSwiss, in which we take a financial instrument and the analysis includes a detailed look at the value from the monthly chart and ending with 5/15 minutes.
From Investor to Scalper – series of studies created in cooperation with broker BDSwiss, in which we take a financial instrument and the analysis includes a detailed look at the value from the monthly chart and ending with 5/15 minutes.
CADCHF for the vast majority of the time was moving in a fairly large consolidation from which market broke out through support at 0.7900 which was a response to “Black Thursday” in January 2015 -as a result, pair established than historical minimum , which is located at 0.6211
Highs were established in July 1991 and are located at the level of 1.3910.
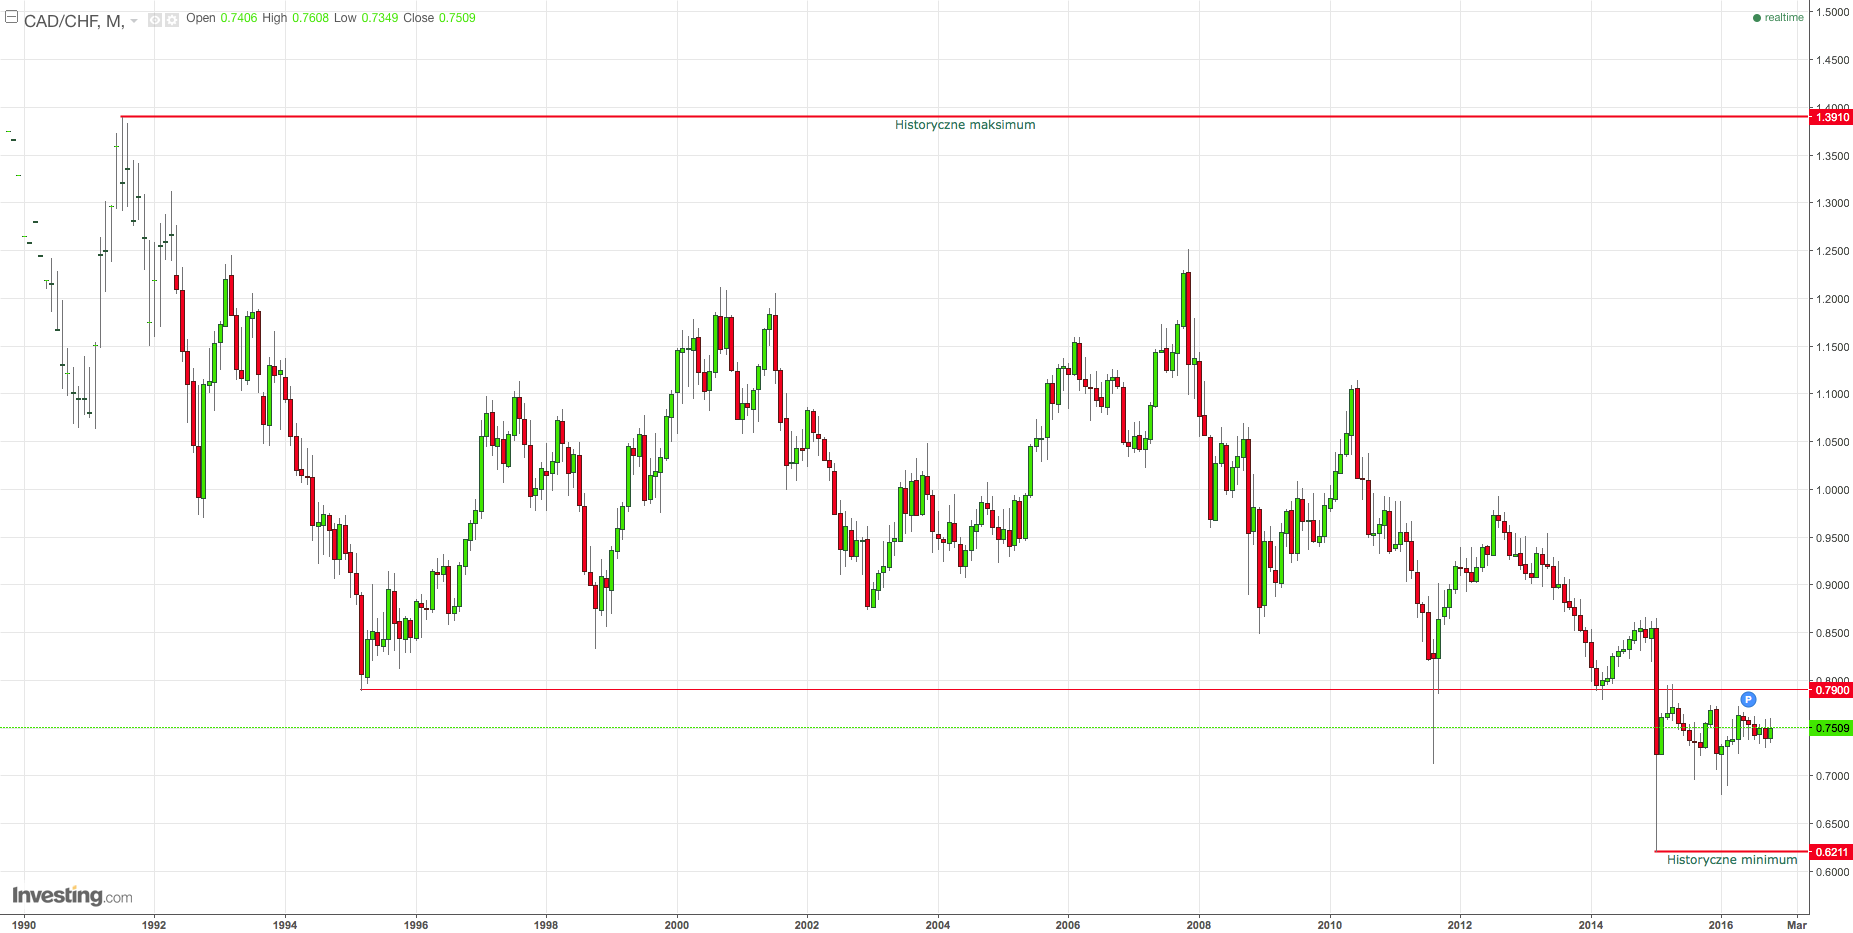
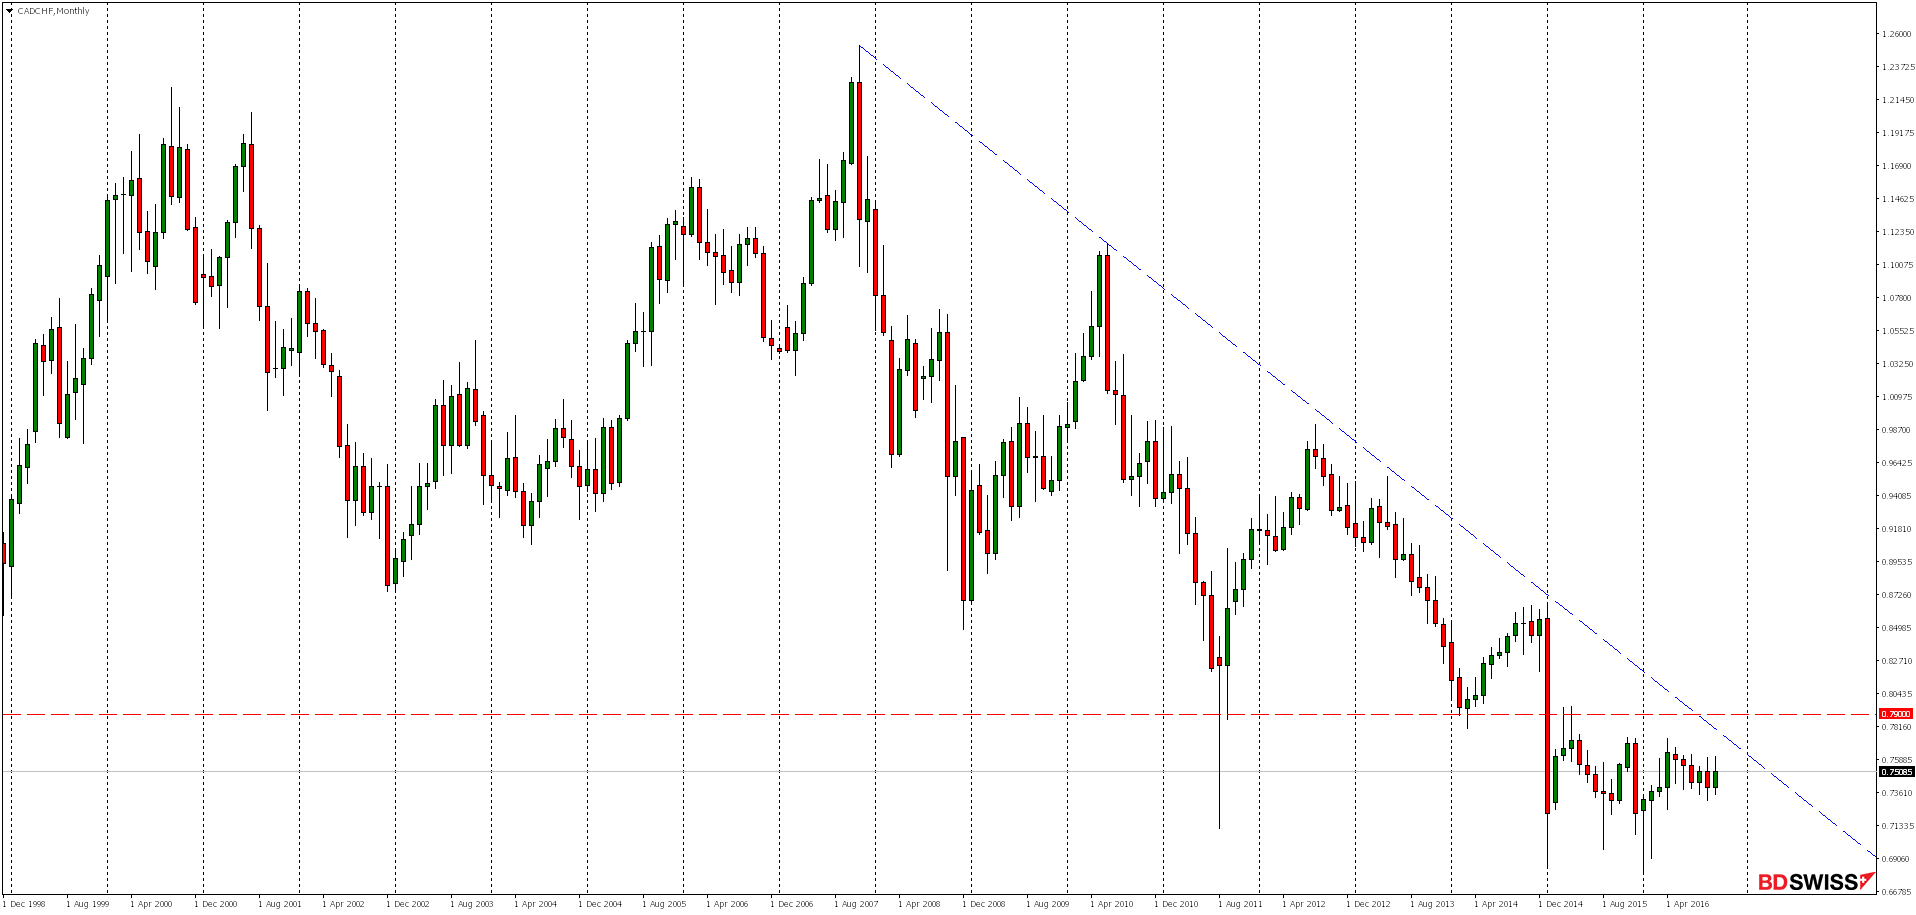
Looking at the current situation on the monthly chart we see that for nine years the market moves down. Currently for two years we have seen consolidation, which is slowly approaching the downtrend line. Rejection of this resistance could be a signal for continuation of declines.
On the weekly chart since mid-April we observe move in downward channel which is a correction for increases from the beginning of the year. We are now in the vicinity of the upper limit of the formation, the rejection could be the signal for declines in the vicinity of the lower band of the channel.
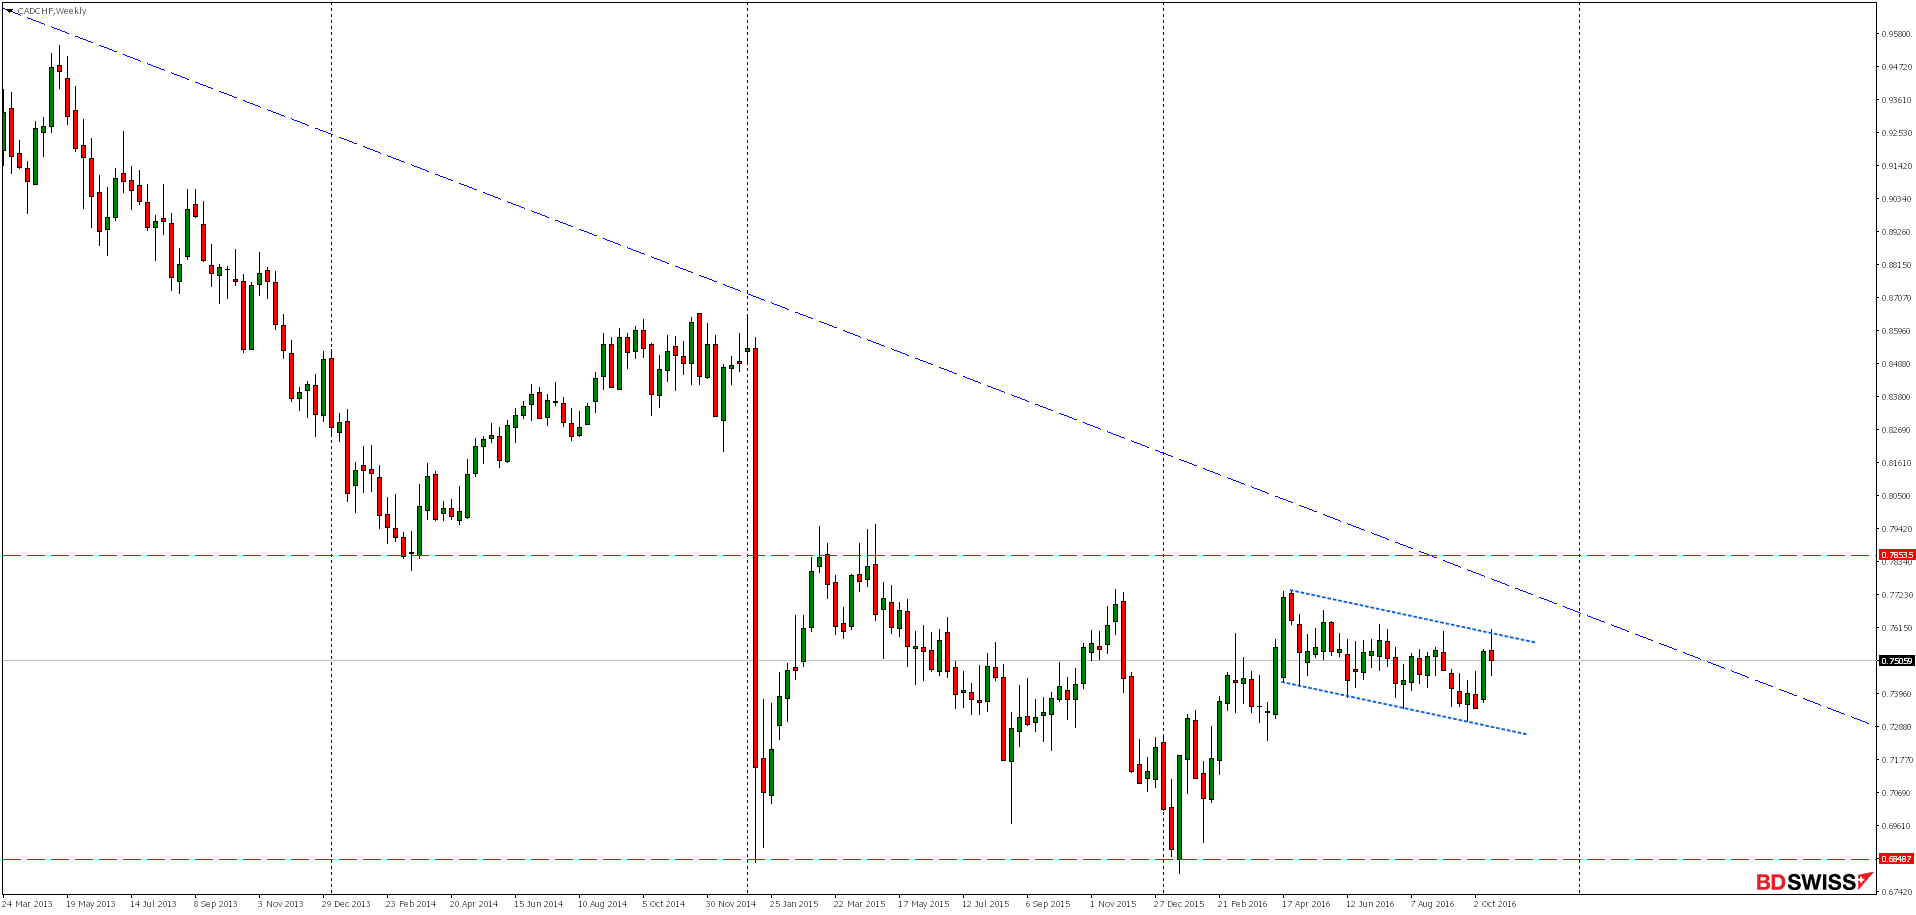
Given the strong growth impulse from last week worth considering also appears to be pro-growth scenario and the upside breakout from the channel and continued growth.
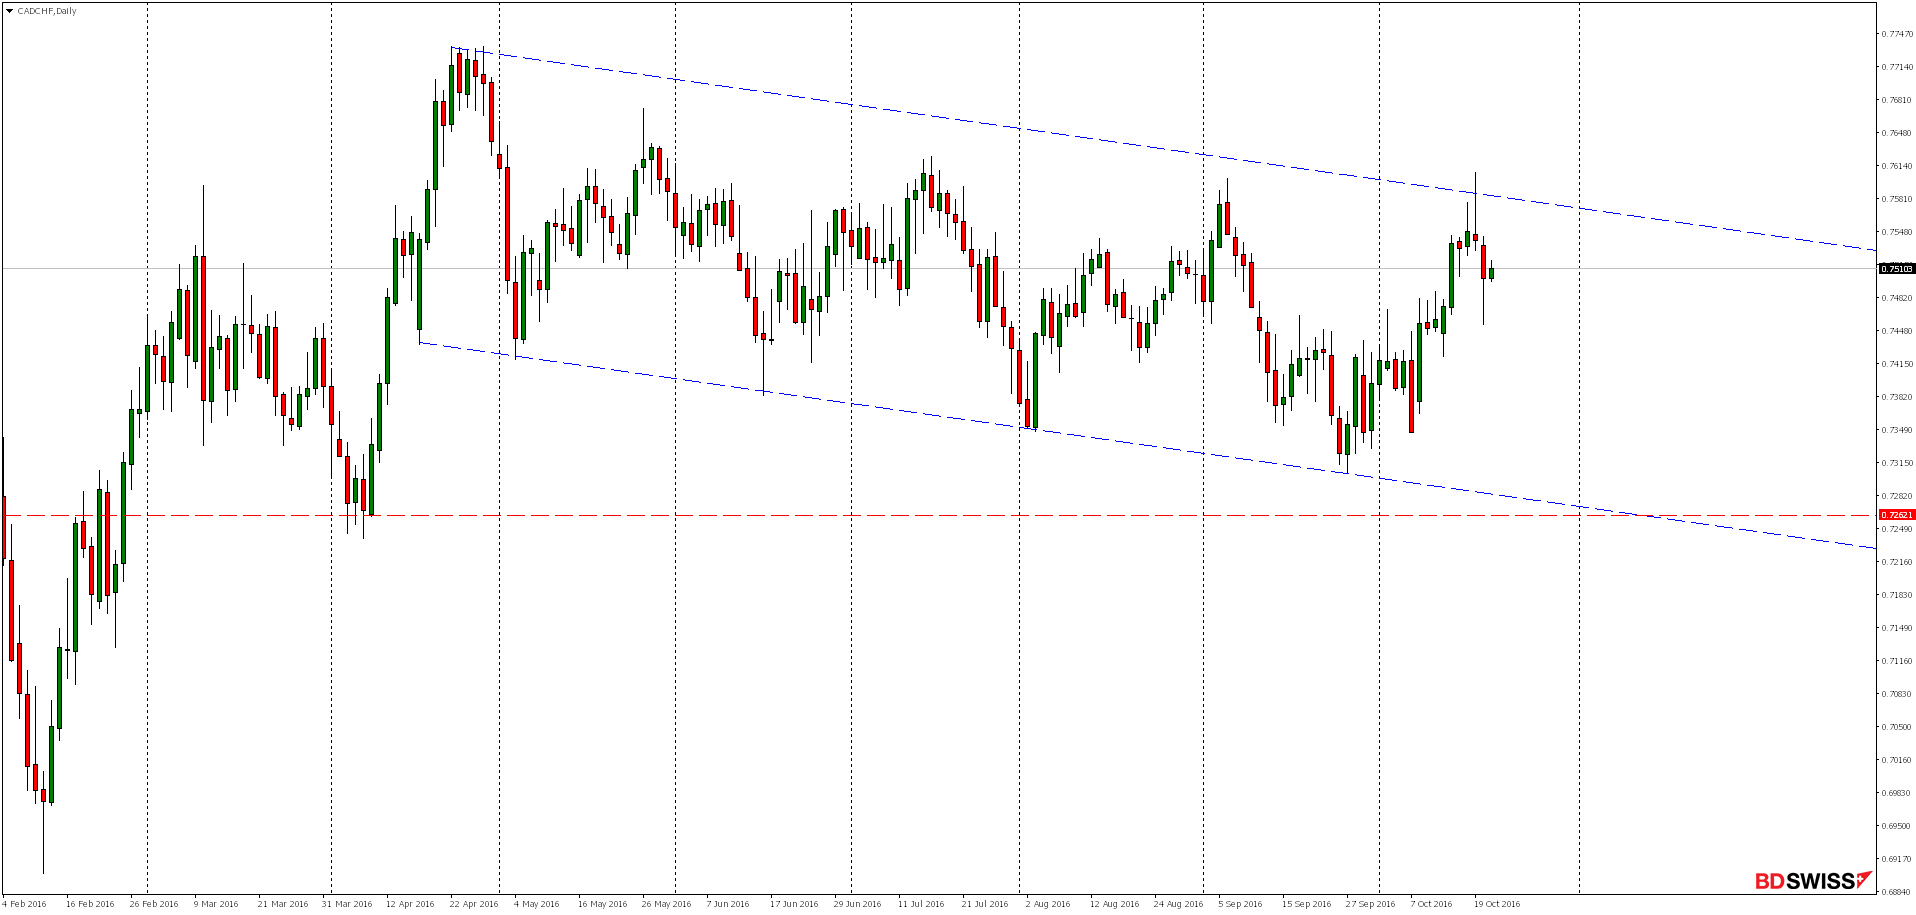
On the daily chart, we see a strong reaction of supply while rejecting of the line of the downtrend and if the decline will continue, then in the near future we expect to test the lower limit of the channel and support 0.7262.
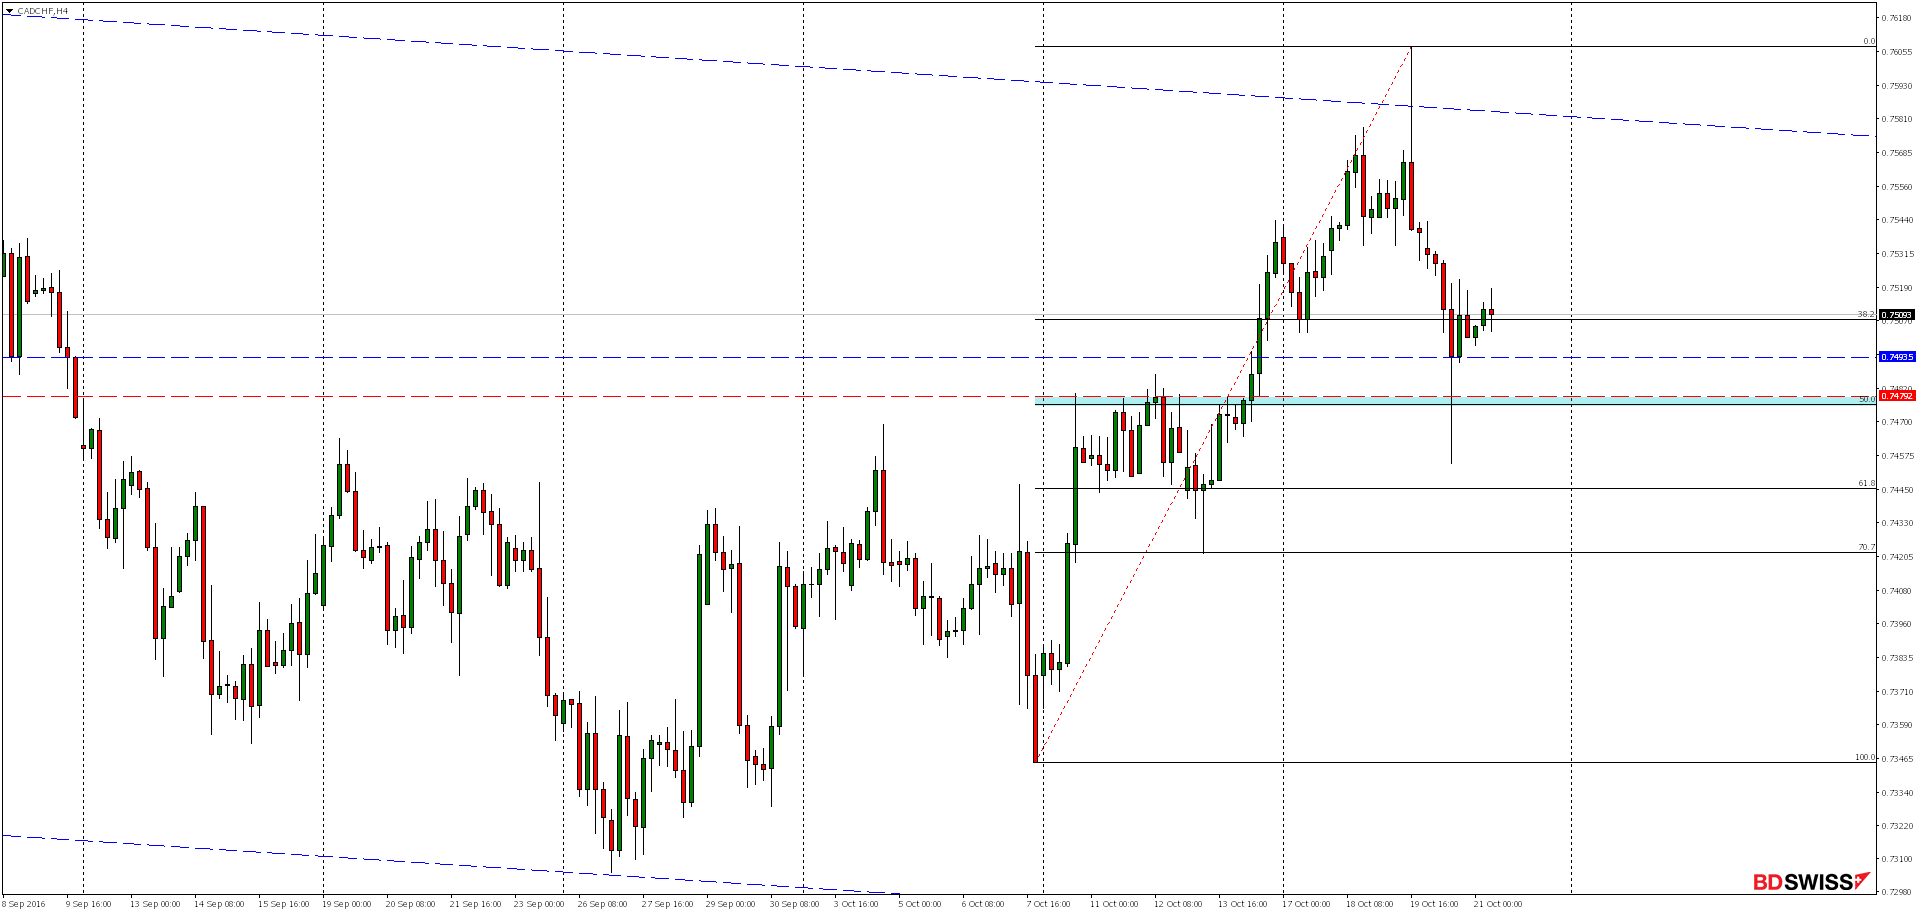
On H4 chart we can see that the drops were stopped in the area of local support 0.7494. Even if bears will have the strength to continue the ongoing since Wednesday declines we could expect strong response from bulls in the area of support zone coinciding with the momentum of 50% Fibonacci correction of the earlier gains.
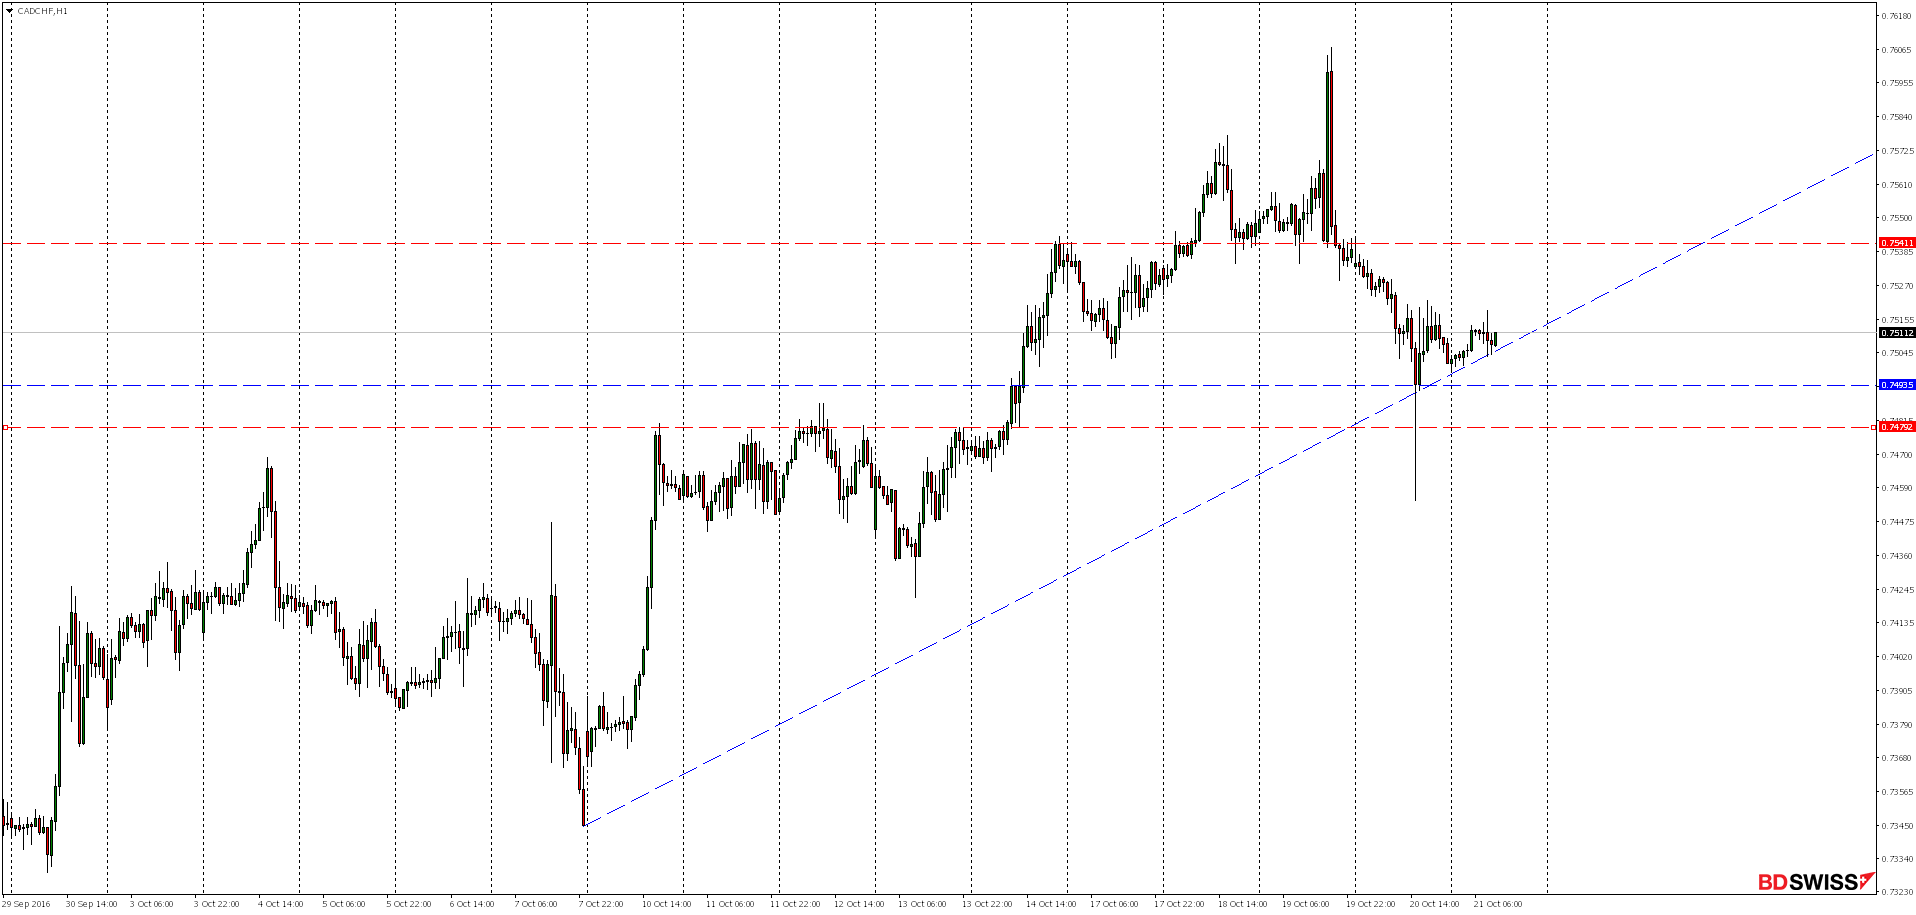
On H1 chart we can see that the market is currently testing the growth trend line and only if demand can again take control, then we might expect increases in the vicinity of resistance 0.7541.
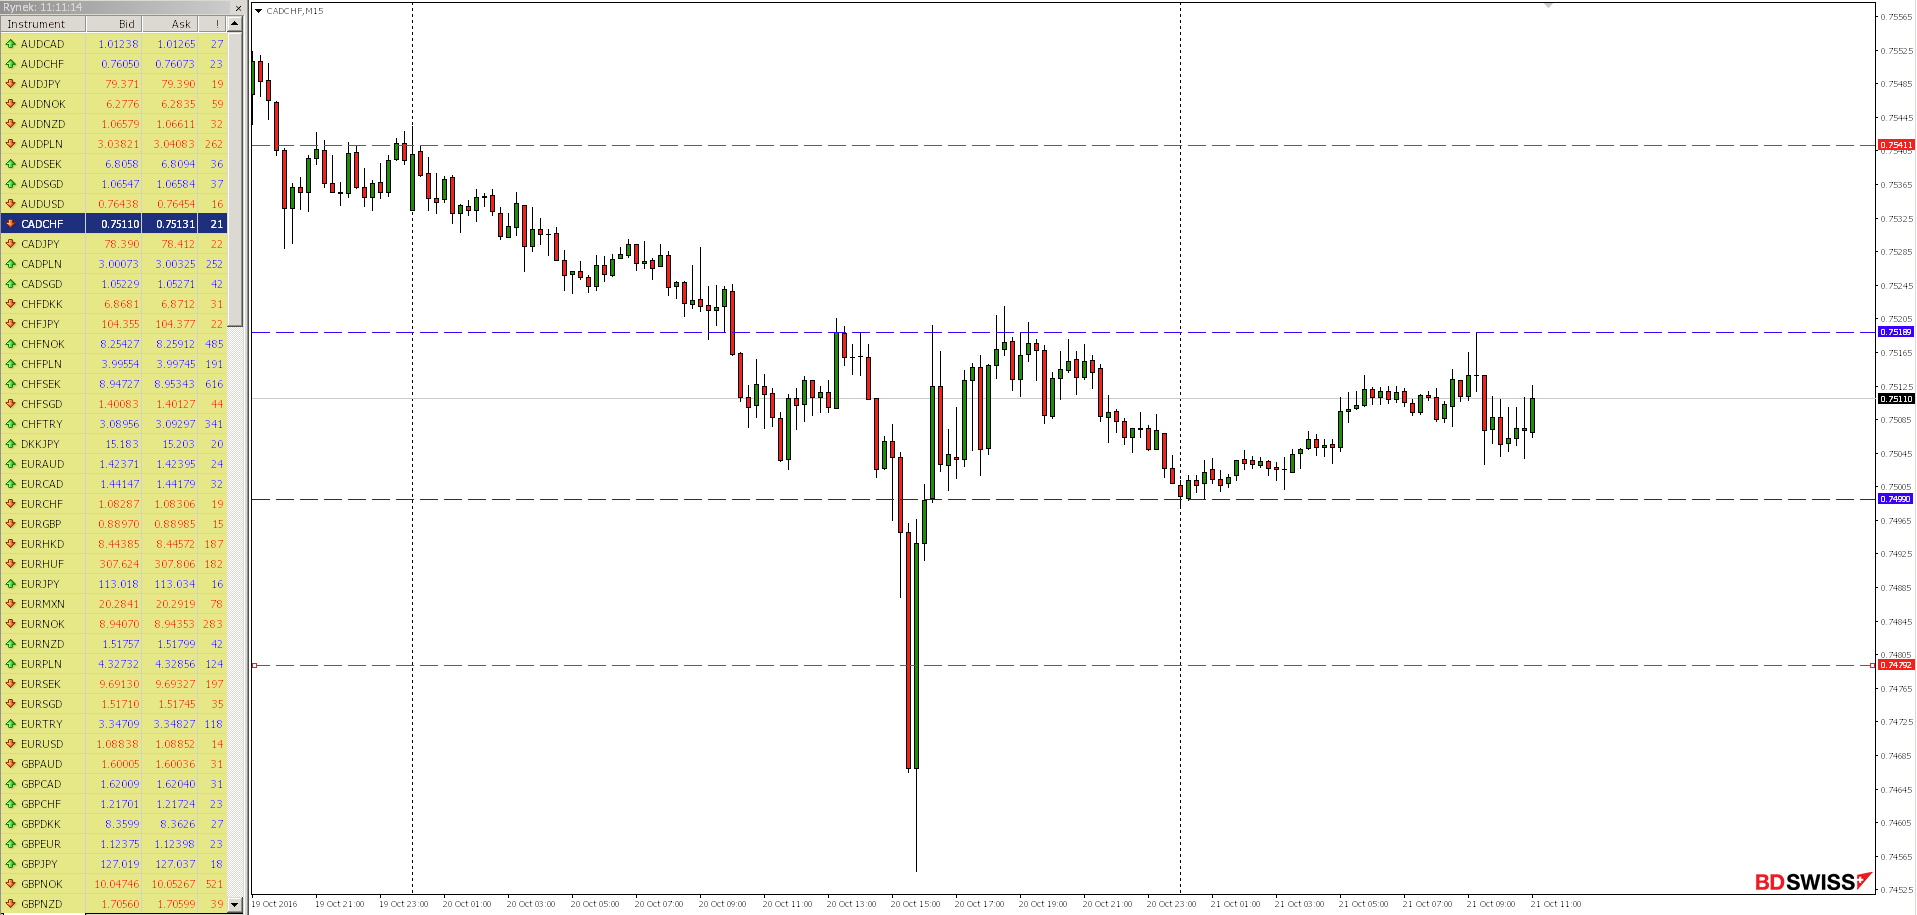
On the M15 chart we observe ongoing since yesterday afternoon, consolidation and only breakout in any of the directions could determine the direction of motion for the closest future.


 Review")


