![]()
![]()
Hi Everybody,
It’s called digital gold for a reason. There are many parallels that we can draw between the physical asset that is the original form of money and this new digital asset that is the future of money.
I remember a time back in 2009 when gold crossed $1000 an ounce for the first time. Investors were feeling generally uncertain about the future of Europe and inflation in the USA and were fast reverting to gold as a source of stability. Analysts were calling for $2000 an ounce, some were as aggressive as $5000.
(This chart shows the price from 1960 until today)
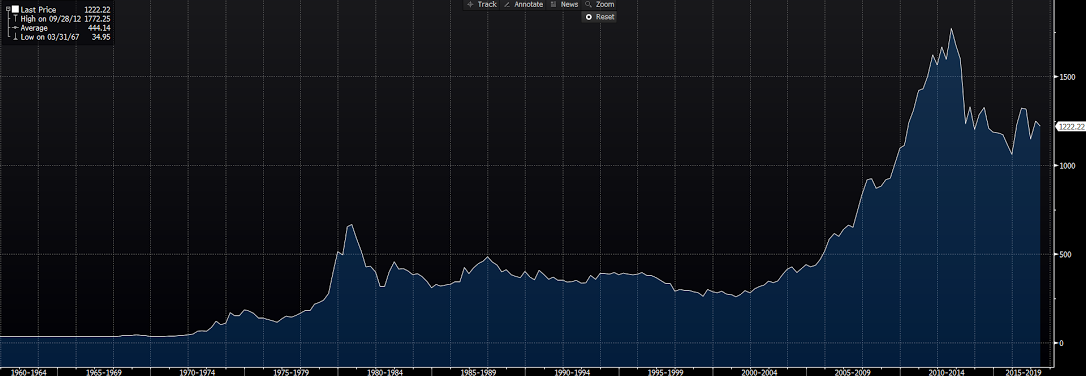
It never did get to $2000 though. The highest price came in at $1920 an ounce in 2011. At that time leverage requirements changed in the USA and eventually, sentiment shifted.
“In the long term, the price of gold will always rise.”
My grandfather taught me that and I still believe it’s true. If you’re a short term, high risk trader in a six year bear market that sentence bears little relevance.
The purpose of this writing is not to scare you. Rather, we need to note that cryptocurrencies are the most fast paced market since the beginning of time. I do believe that we’re moving to a digital economy very rapidly and that the value of the blockchain will need to rise sharply in order to support that, but as prices can fluctuate extremely rapidly, we should at least explore the possibility of where it might go if a major pullback does come.
Always think about the other side of the coin. 😉
Volumes
Japan has already legalized it. A major infrastructure change is coming very soon in the world’s third largest economy. We know that Bitflyer has signed a contract that ensures bitcoin is accepted at hundreds of thousands of retail stores across the island nation and that about 20 new bitcoin exchanges will be coming online shortly.
India is currently reviewing the option to legalize and regulate digital currency. After the harsh and rapid demonetization, they’re in sore need of an alternative to paper money. They have a panel working on it now and hopefully, we’ll get some good news in the coming weeks.
On or before Monday, May 15th, the SEC will deliver a decision to either approve or deny the world’s first bitcoin ETF, which if approved will open the markets to Billions of Dollars in institutional investments.
As I’m writing, the total market cap of bitcoin has just breached $30 Billion for the first time ever. A notable milestone but still not nearly enough to support the global economy, which now stands above $1 quadrillion.
However, according to coinmarketcap.com, the current volumes are coming from Poloniex, Kraken, and Bithumb (Korean exchange). Bitflyer is less than 3%. This tells me that most of the money flooding in at the moment is in fact, speculation money.
Technical Analysis
In January, I made a video called Bitcoin Rush, that descibed the simple technical analysis pattern that the price has been following.
You can see the video here: https://youtu.be/K4oRb13hOpw?t=4m46s
Since that video, the pattern has held outstandingly well. Of course, past performance is not an indication of future price movement but if the pattern continues this is what we can expect.
This graph shows the price of bitcoin over the past year and a half.
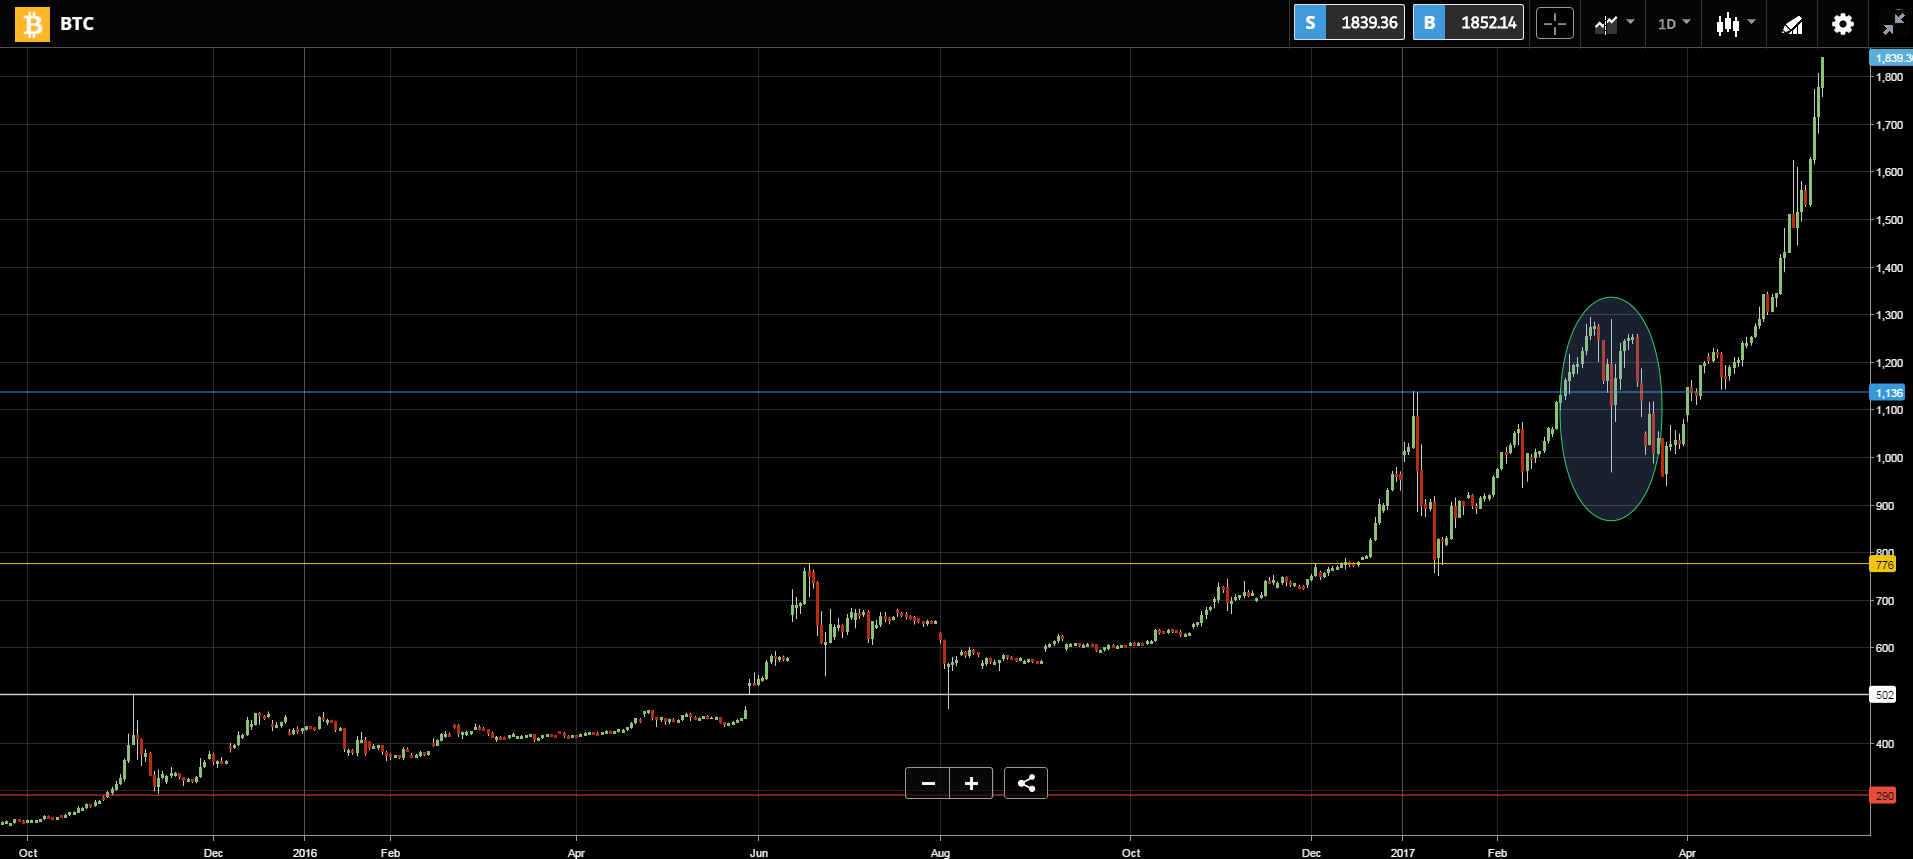
The red, white, and yellow lines are covered in the video. To recap, every time the price breaks a line, it continues to surge until it finds an arbitrary price to turn around, then comes back to touch, or even dip below the previous line.
Since the video was made, the price went all the way up to $1336 (blue line) then indeed retraced back to the yellow line just below $775.
Let’s ignore for now the green circle, which is the excitement around the first SEC ETF decision. We can see the massive spikes on March 10th when the ETF was declined but the long term price moves were not affected.
Trade with others. Join eToro community and use experience of other traders!
Now, let’s hope that the price continues to rise, the tipping point comes, and we never see it at $1800 a coin again. But…. if we do see a retracement, there is no support on the chart until $1136, or possibly $1292 (the highest price inside the green circle). Either way, the next support is more than $500 away.
Best regards,
Mati Greenspan
Senior Market Analyst


