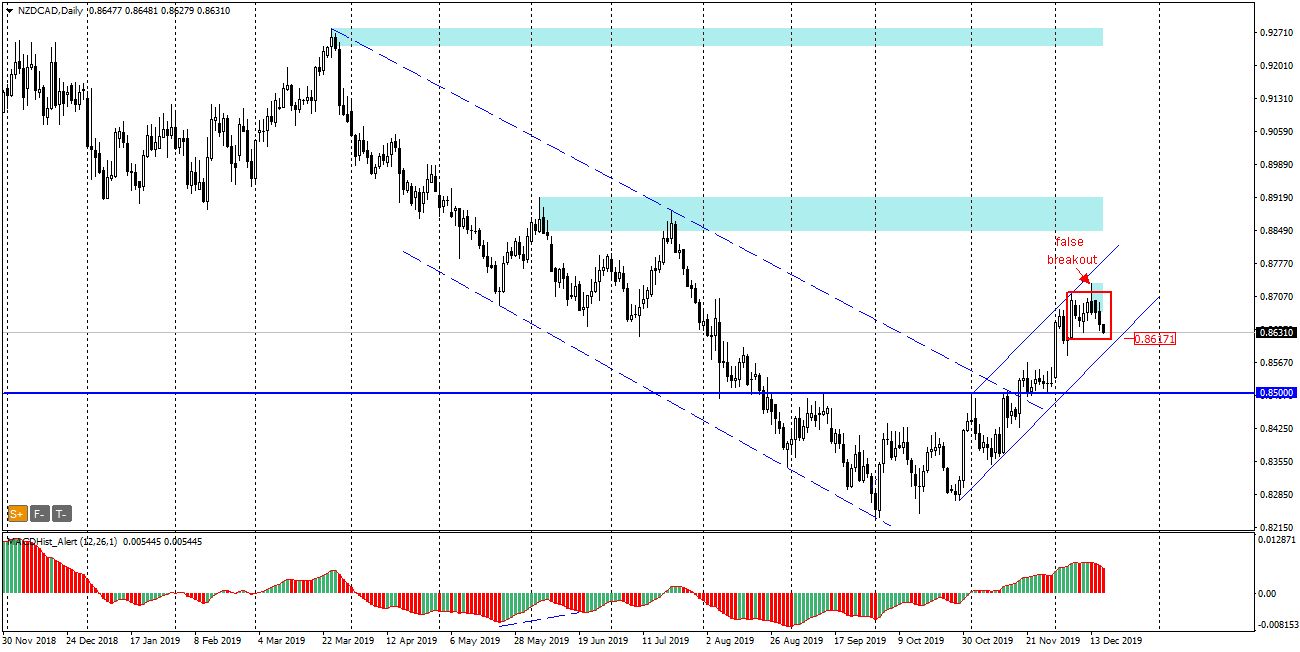
Since March NZDCAD pair has been moving in a downward trend, from which 19.11 there was a breakout. Since then the correction is in progress and the price moves in a growth channel. At the beginning of December the price reached the resistance of the channel and the daily candle of December 6th formed an inside bar pattern. On 13th December the pair topped the formation, but at the end of the day the quotes returned to the inside of the IB indicating a false breakout. MACD on the daily chart is in a downward phase.
From Monday to Friday – Live trading at 13:00 (London time) chat, analyse and trade with me: https://www.xm.com/live-player/basic
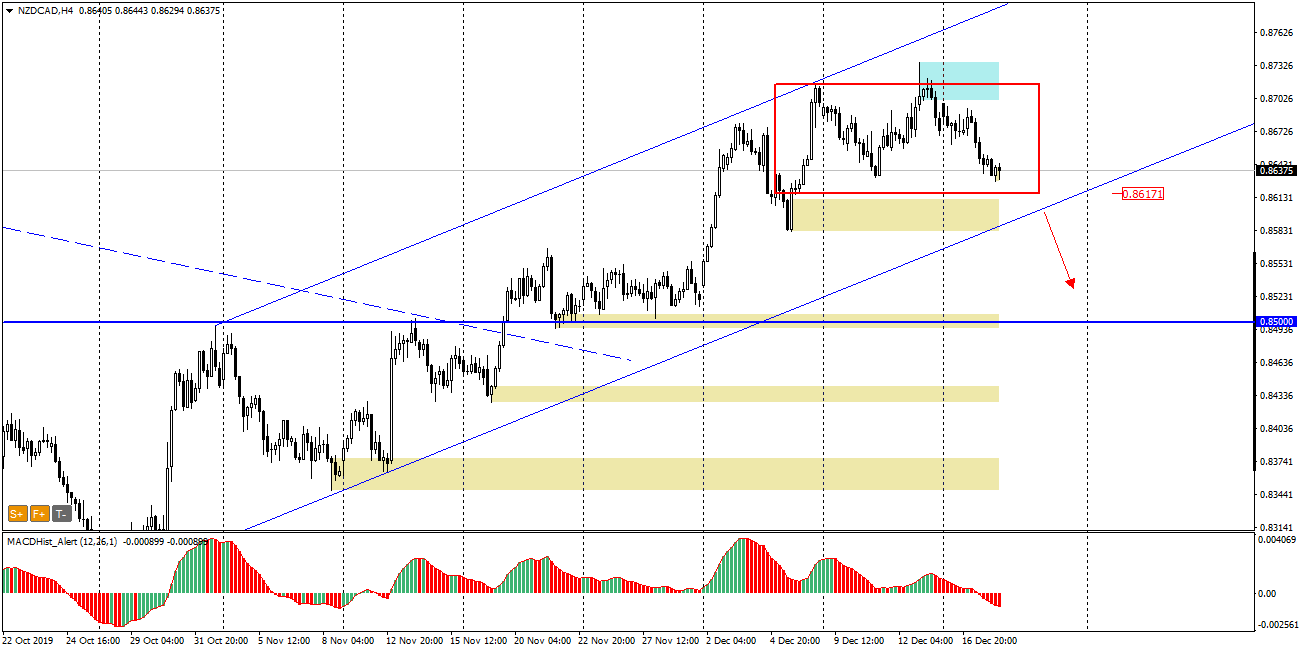
Looking at chart H4 we can see that the price is approaching the lower IB limit near which the demand zone and channel support are located.
It is worth observing the price behavior and if the channel support is successfully defeated (the daily candle will close below) it can be an impulse for dynamic declines and the supply target can be S/R = 0.8500.
In our Facebook group, which you can join anytime: https://www.facebook.com/groups/328412937935363/ you will find 5 simple strategies on which my trading is based. There, every day we post fresh analyses of currency pairs and commodities


 Review")


