The quotations of the NZD/CAD currency pair since establishing the high, two years ago, is moving in a downward trend, the bottom of which was set in October this year at 0.8320. As can be seen in the monthly chart below, for the last two months, the bulls managed to recover most of the losses from the half-year period. Increases are also continued in the current month, where the price is once again approaching the two-year trend line.
I trade on this instrument at broker XM, which has in its offer more than 300 other assets >>
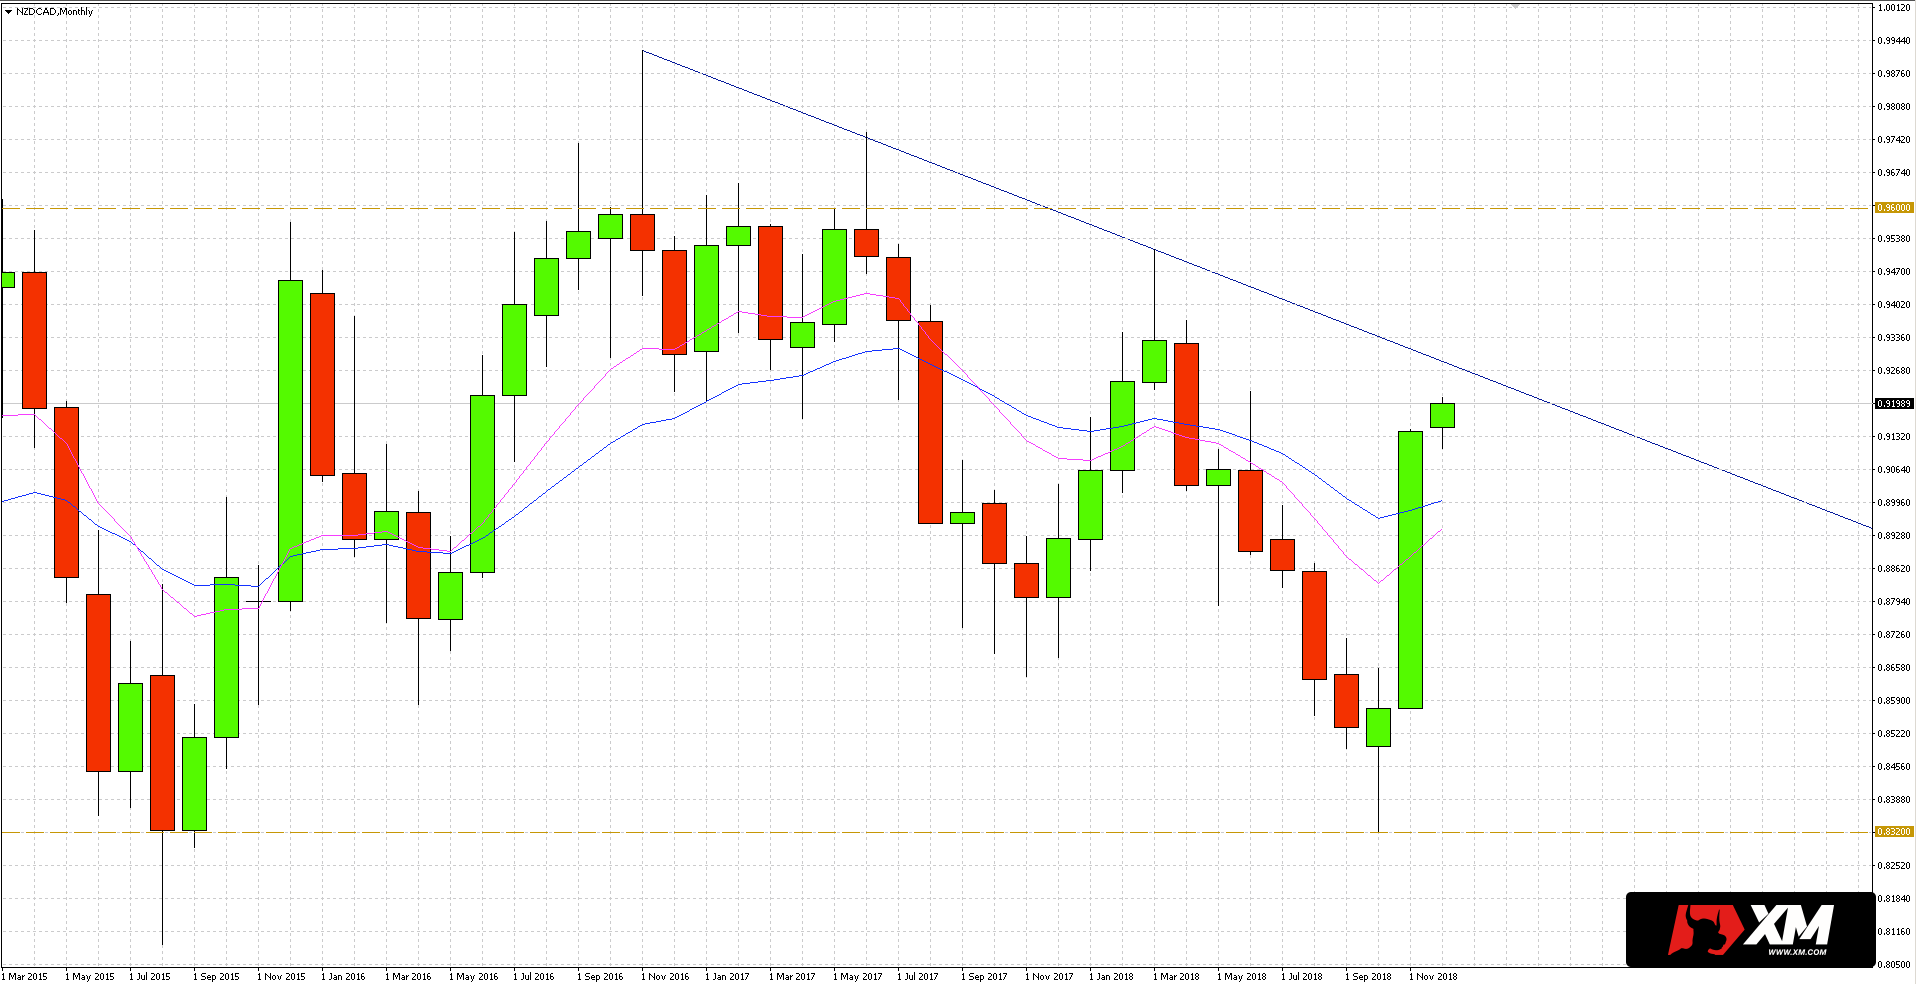
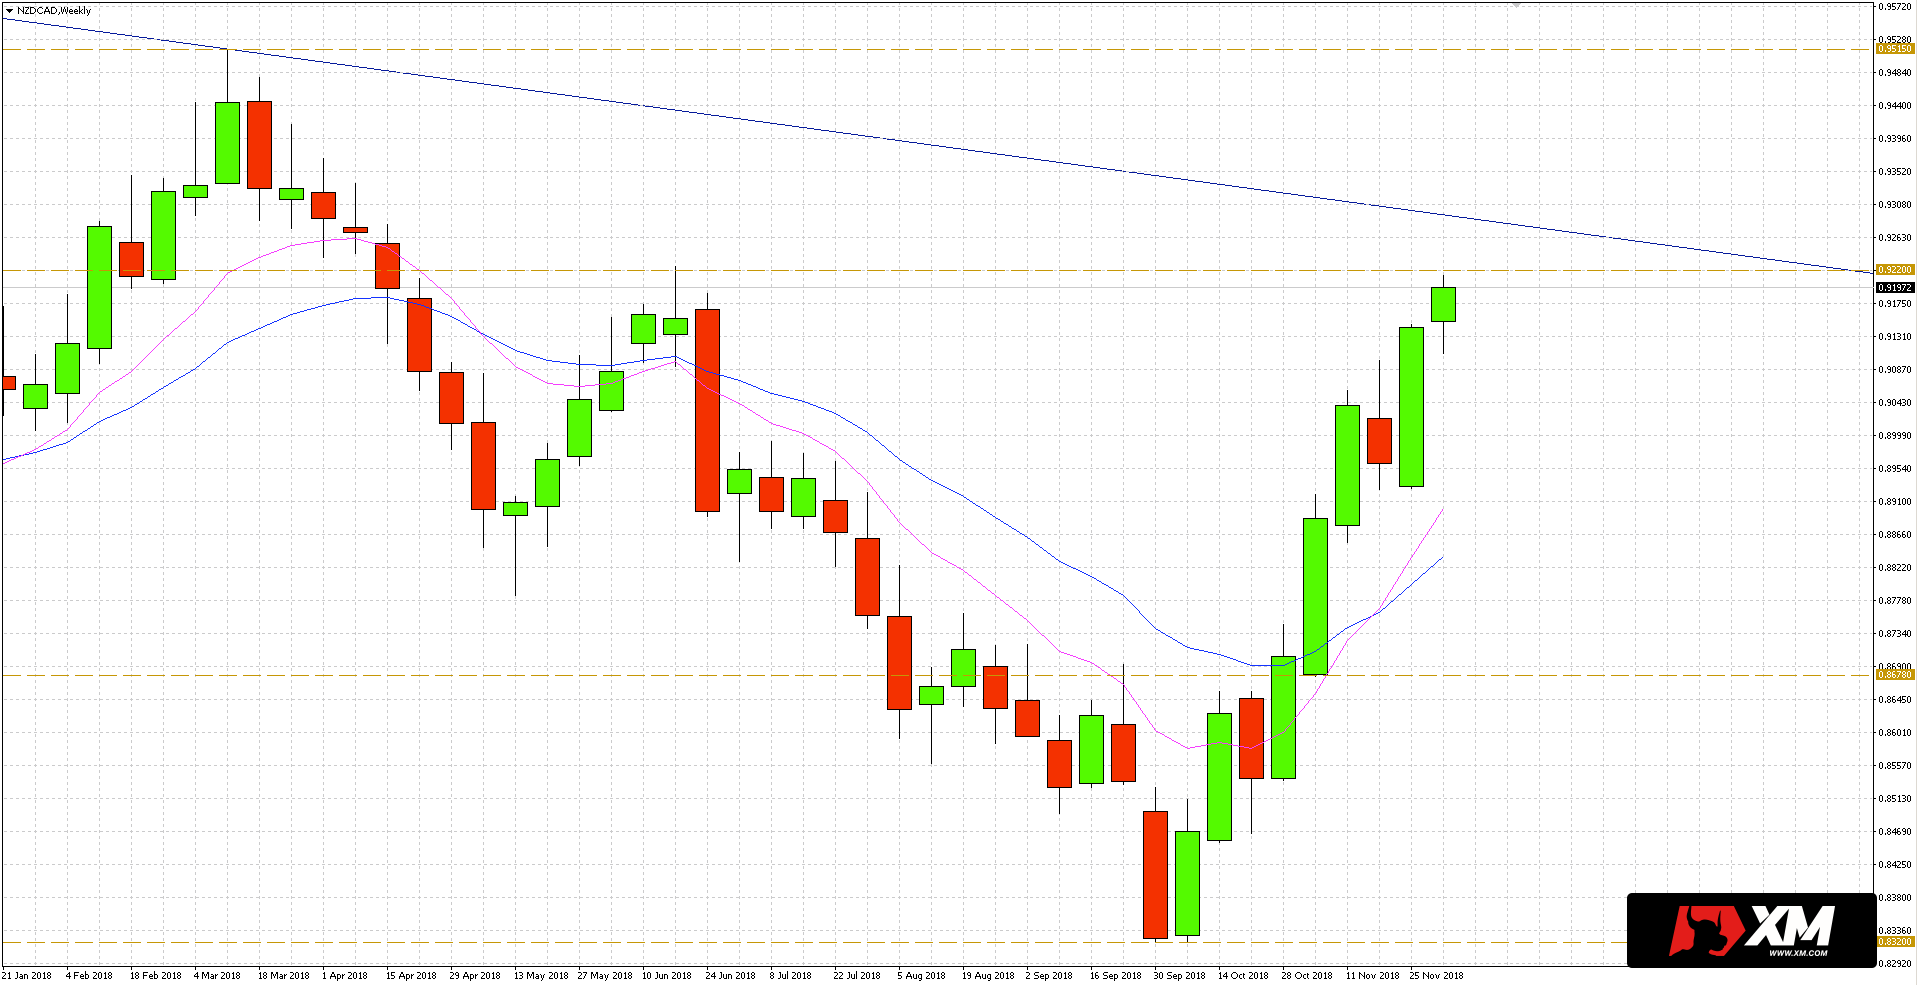
A lot depends on the test of the mentioned trend line, but also horizontal resistance from the weekly chart, which is located around 0.9220. The rebound would be a healthy correction, as the price moved away from the average EMA 10/20 channel. On the other hand, after successfully defying the resistance, the New Zealand dollar could go to the high from March at 0.9515. Not much higher, at 0.9600, is the key horizontal resistance that has stopped buyers for over 4 years.


 Review")


