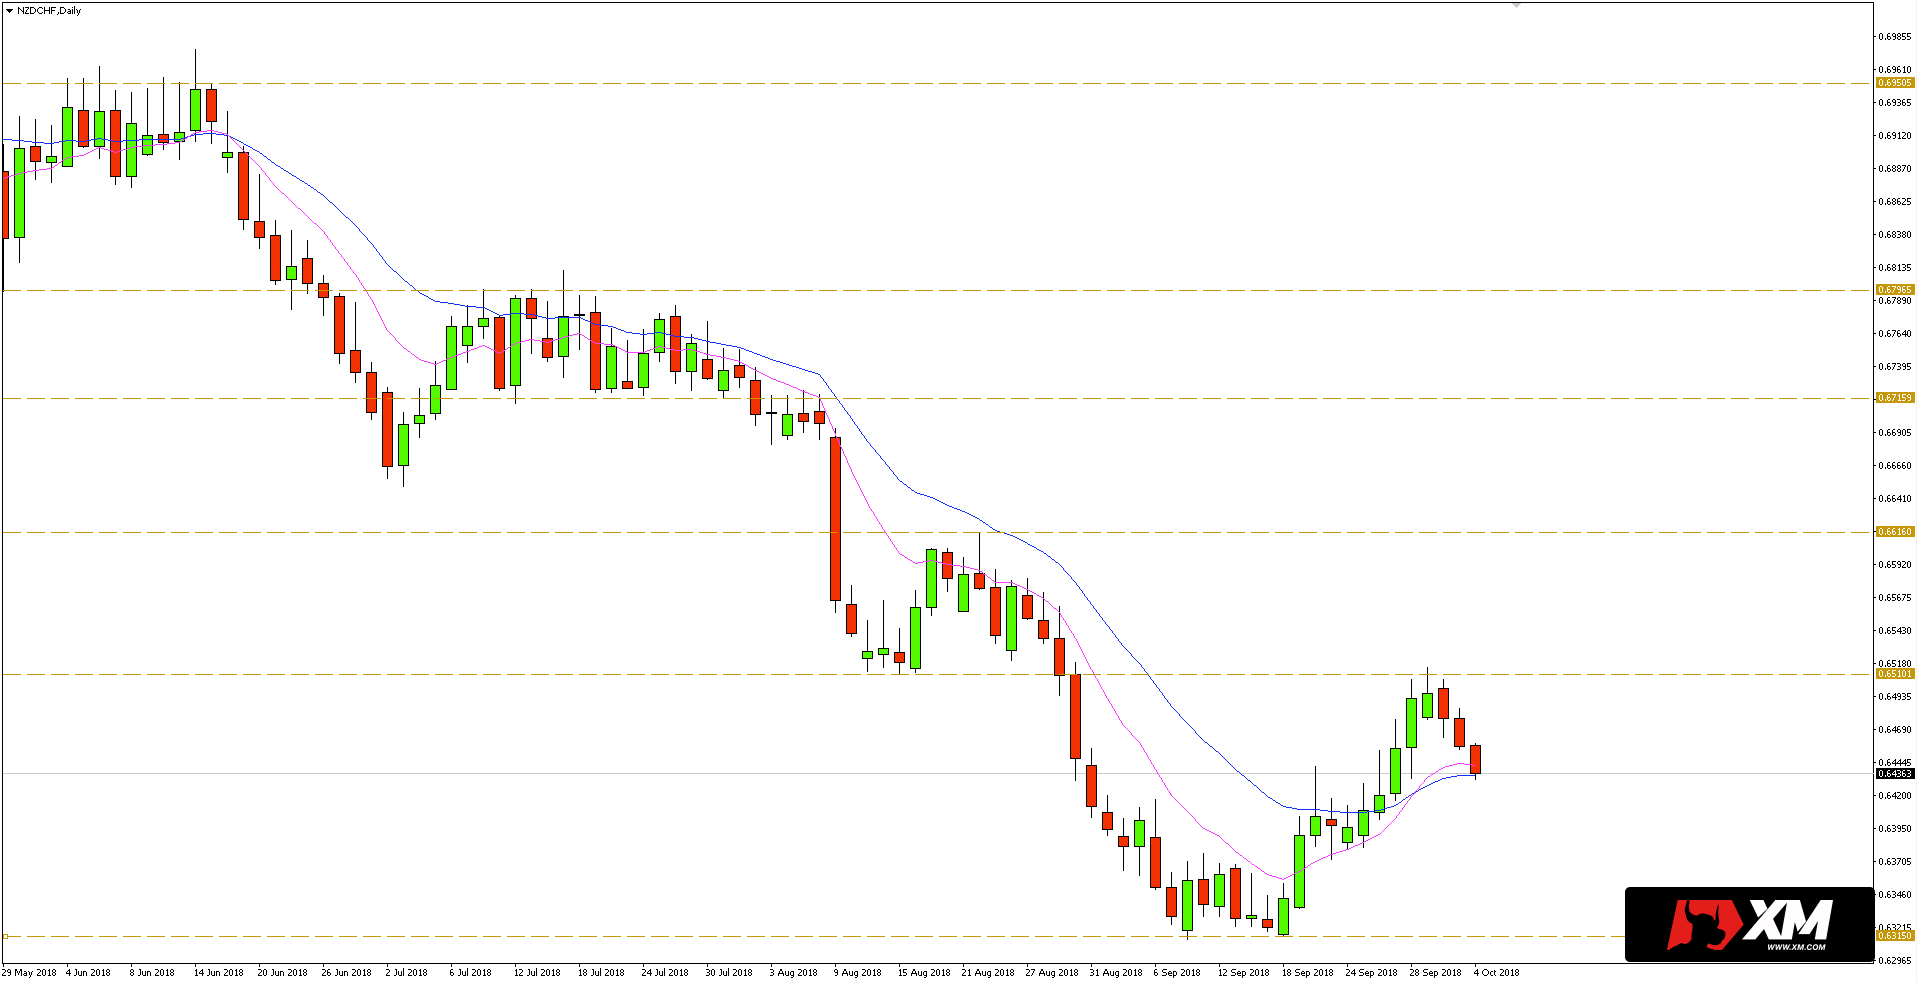
NZDCHF currency pair moves in a downward trend as evidenced by the highs and lows formed at lower and lower levels. As can be seen in the daily chart below at the beginning of the current week, the price reached the resistance at 0.6510, which previously served as support.
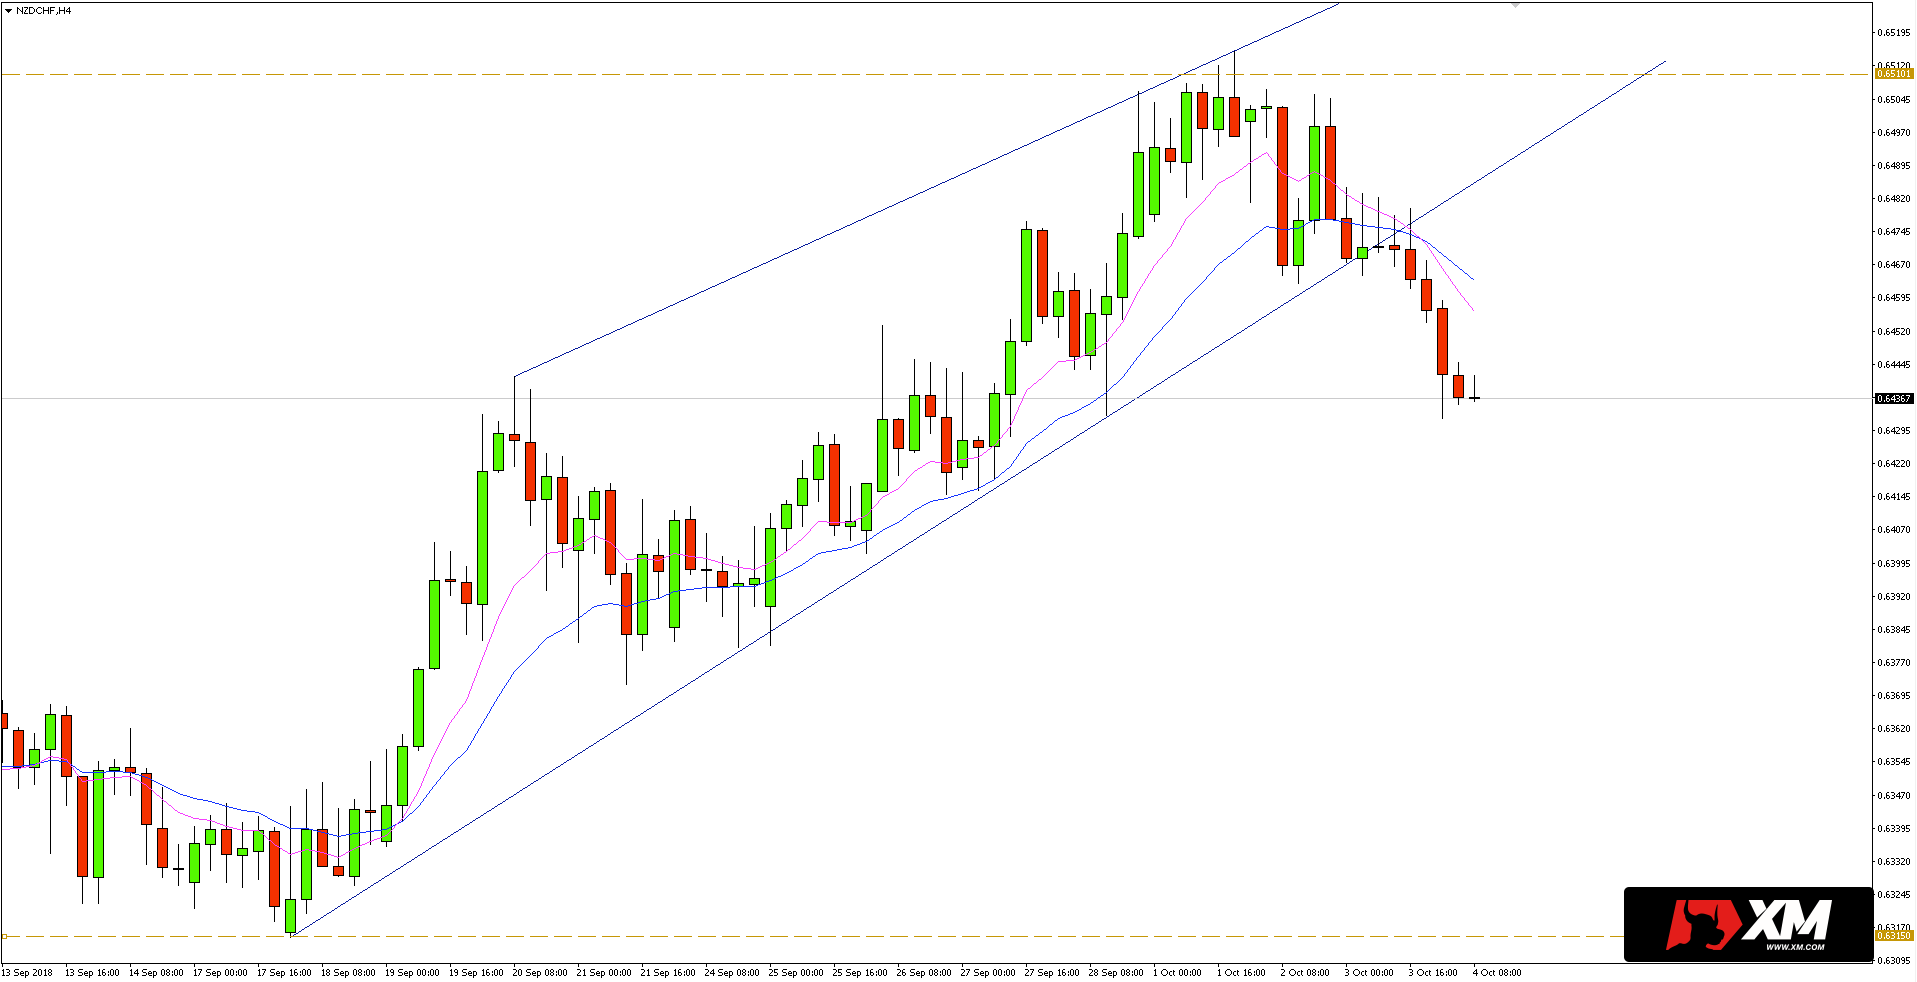
 On the other hand, after switching to a 4-hour chart, we see that after rebounding from the resistance at 0.6510, the quotes broke support in the form of a trend line running from the bottom of September this year. The price after breaking out moves south, which indicates a return to the downward trend. The key support that can target the bears is near 0.6315. Approximately 65 pips higher, at 0.6380 we will find less important support, where we could see some buy offers.
I trade on this instrument at broker XM, which has in its offer more than 300 other assets >>


 Review")


