NZDJPY was at the end of last week at a key resistance which is a line of downtrend visible on the daily chart below. In addition, this resistance coincides with the horizontal level 75.00.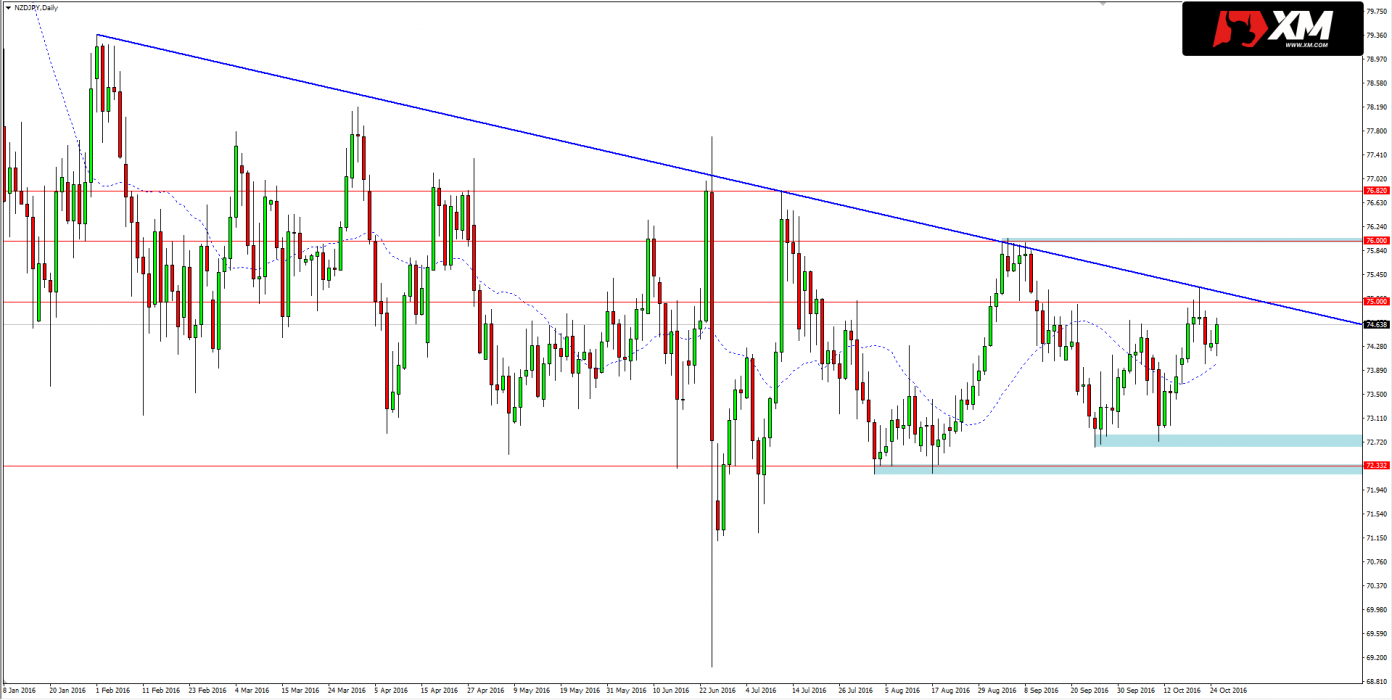 Looking on 4-hour chart we see bearish impulse, which appeared as a result of reflection from the aforementioned resistance. Currently lasts correction of the pulse which can be used to take potential short positions.
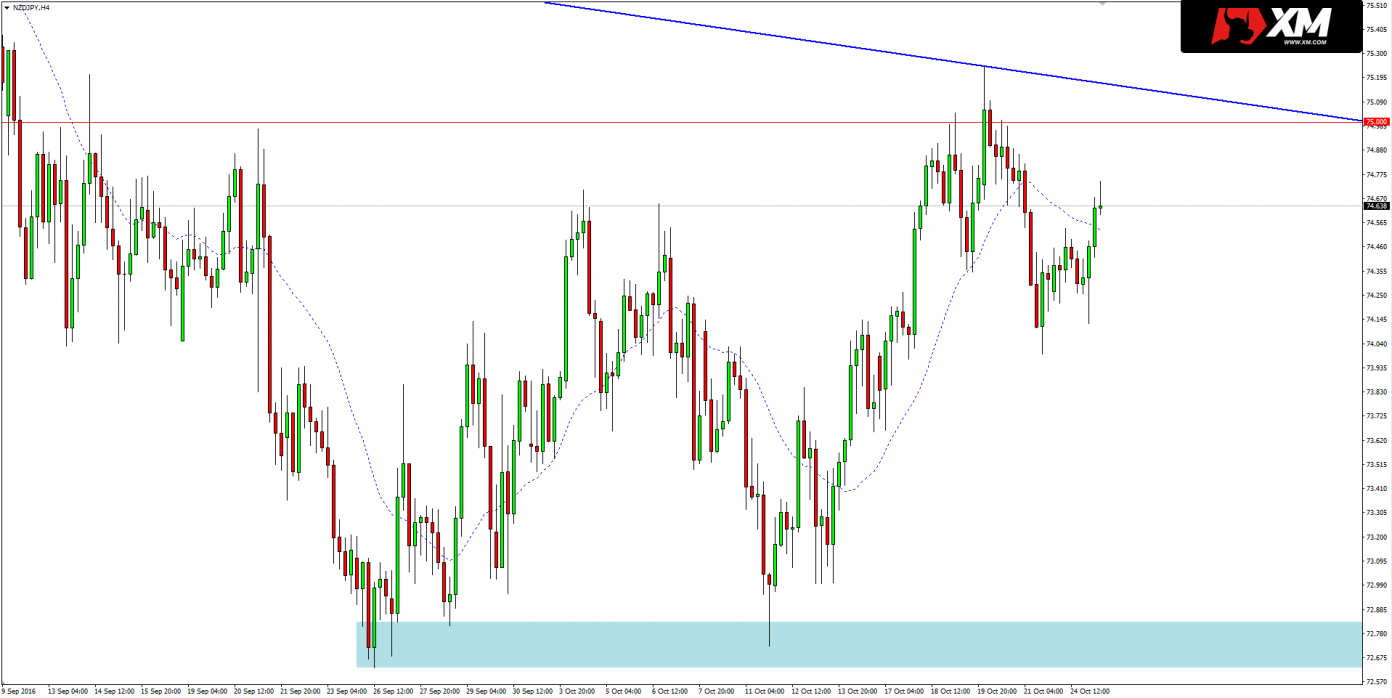 In turn, the opportunity to take a short position may appear eg. on the chart with a lower interval (M30-H1), where during the current correction we should see a downward sequence of highs and lows. A potential target for short positions may be support area located within the level of 72.70. There we find also lows from September and October.


