The pair of the New Zealand dollar with the US dollar (NZDUSD) has been moving in a downtrend interlaced with upward corrections since the beginning of this year. A bullish engulfing formation appeared at the beginning of June, which may signal the end of the downward swing and the start of another upward correction.
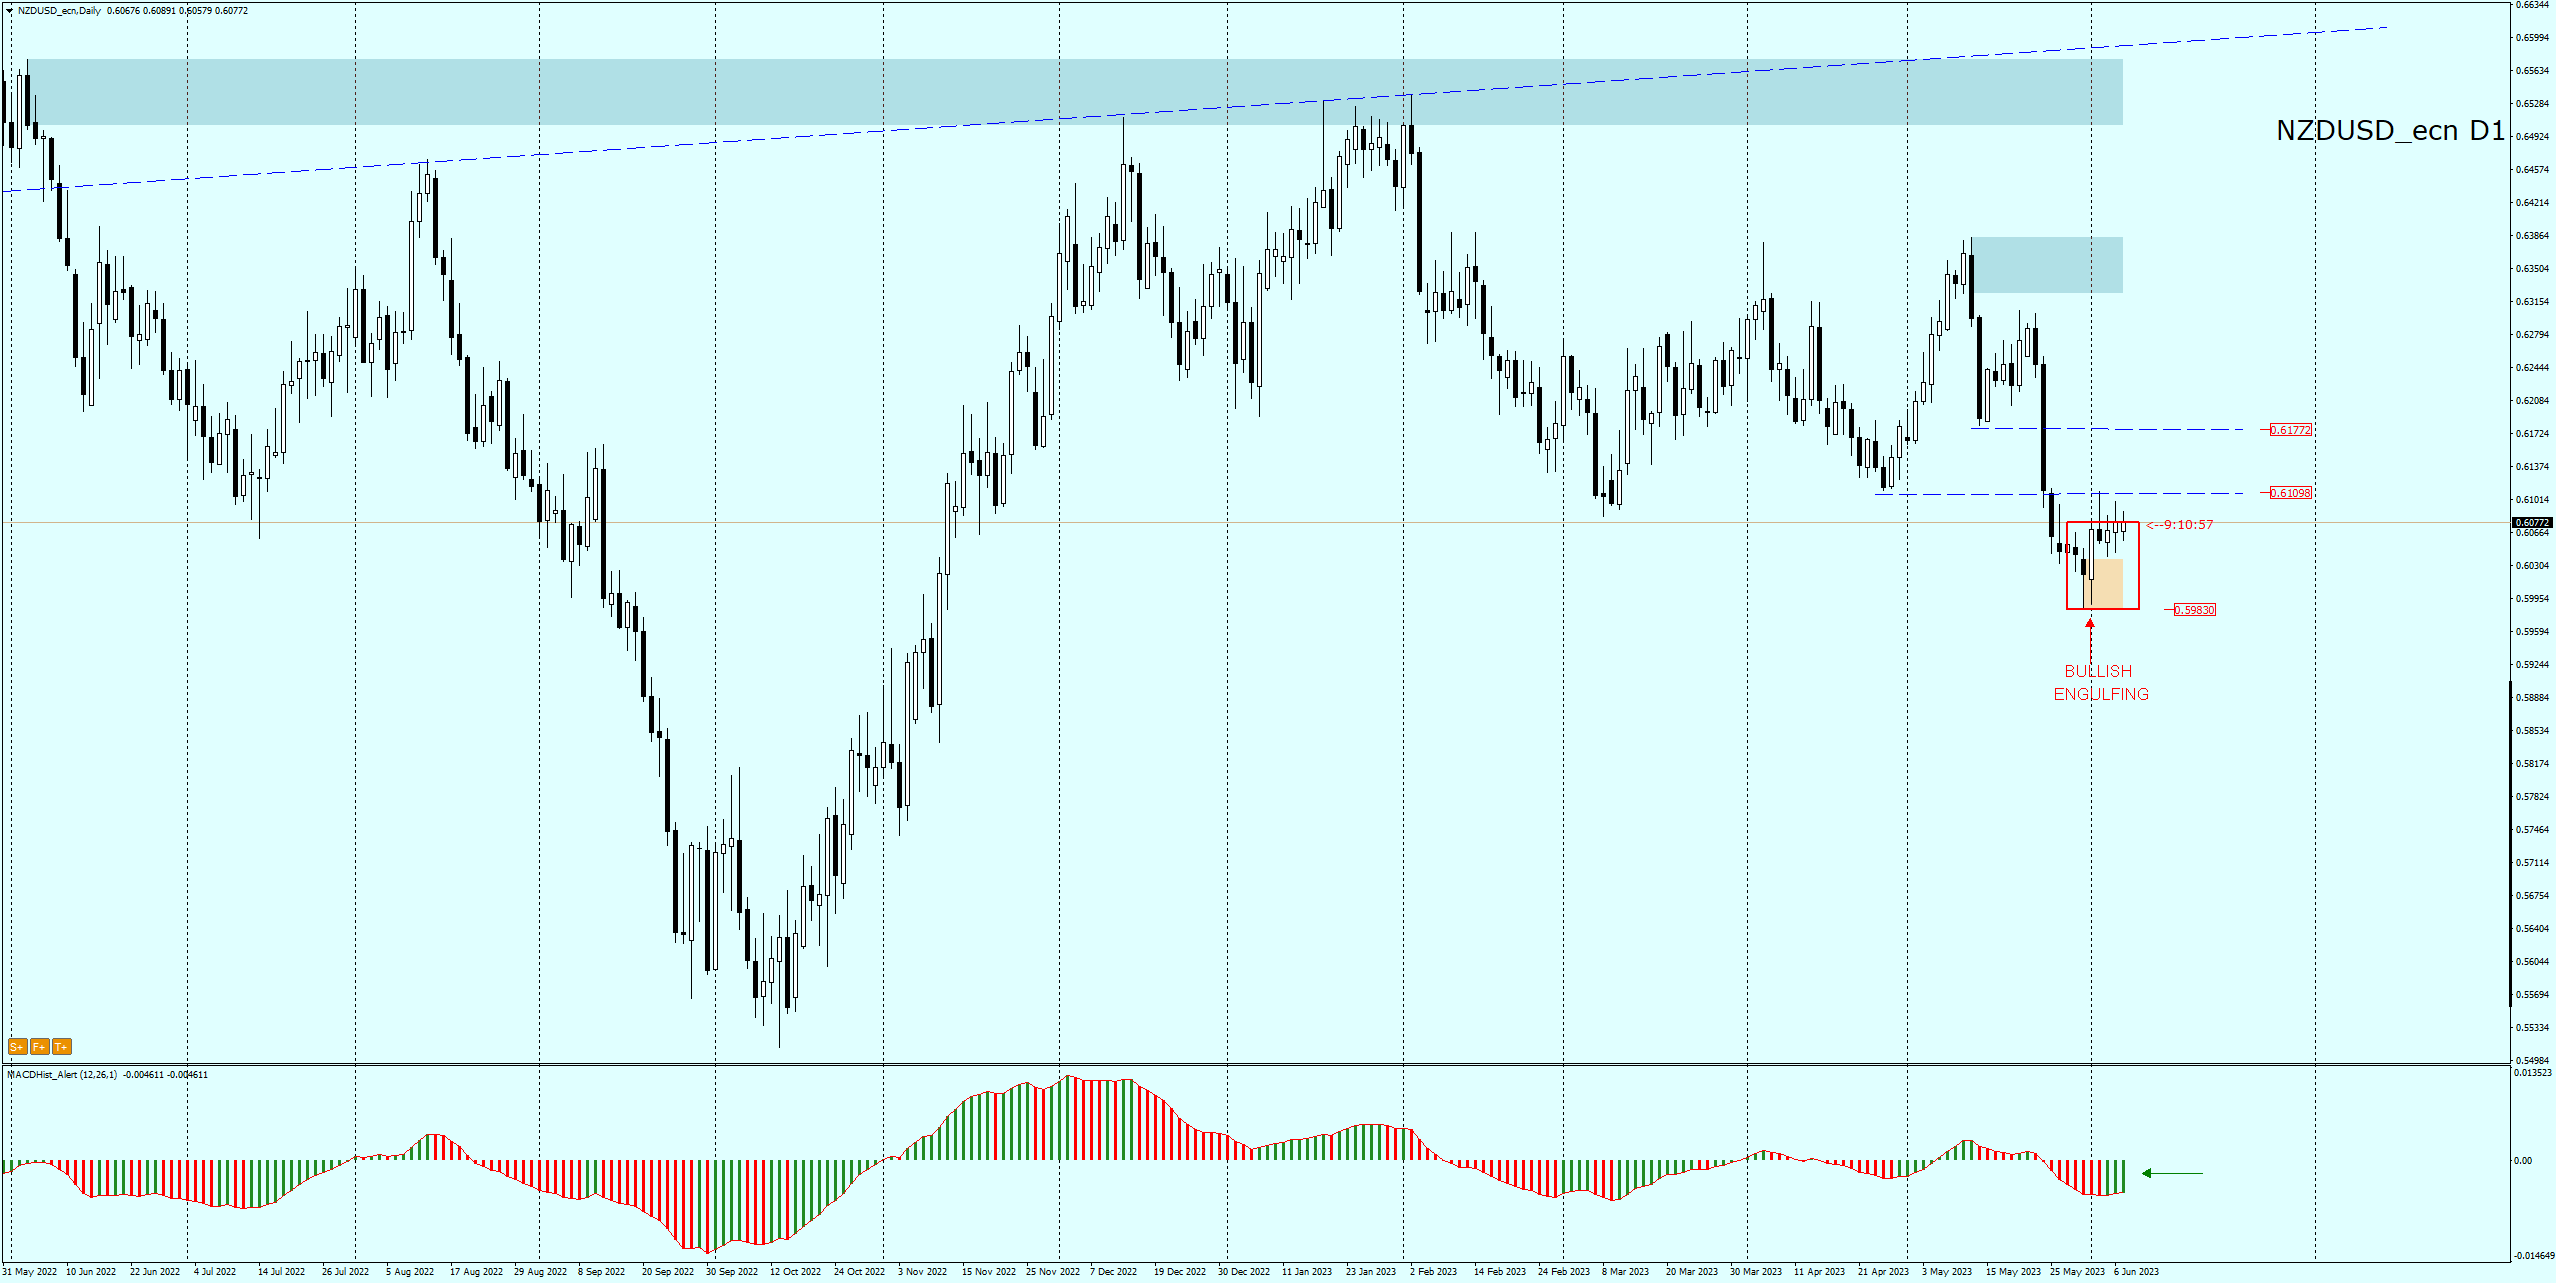
Currently, despite several attempts to break out of the formation, the price is still inside the formation. The MACD oscillator has been in an upward phase for several days. If an upward breakout is successful, the next support and resistance levels at 0.6110 and 0.6177 (marked with horizontal dotted lines on the chart) could be the target for demand.
NZDUSD H4 – possible supply and demand targets
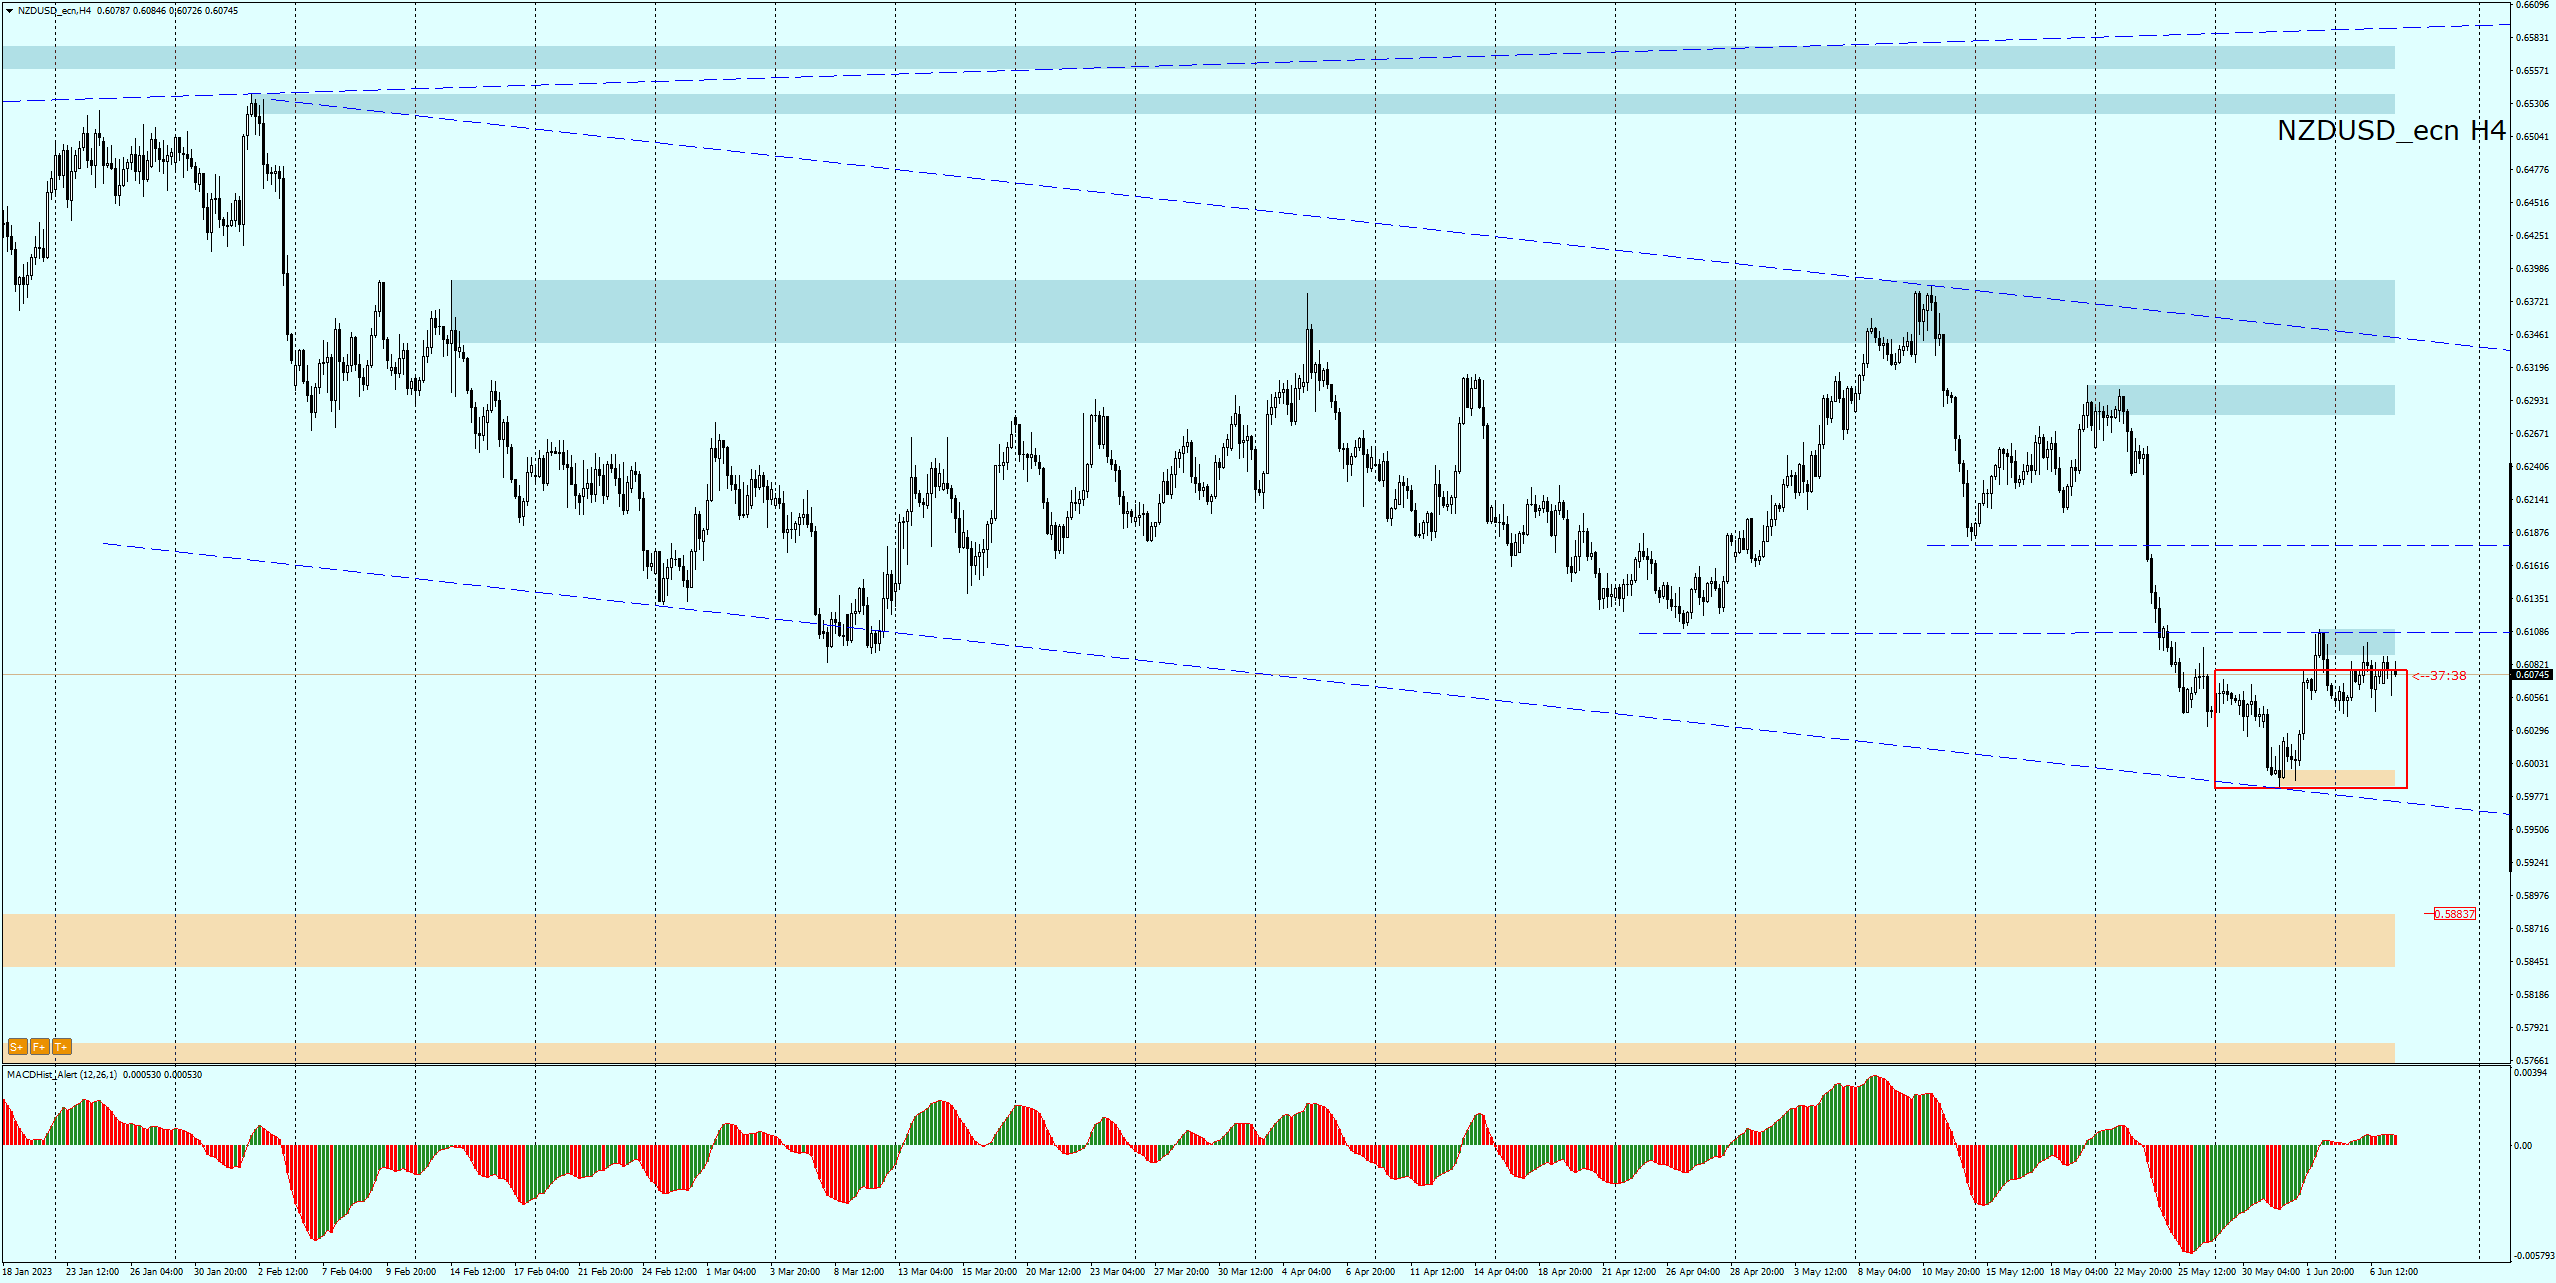
However, if the market were to head south and break out through the lower limit of the pattern, a downward scenario could take the NZDUSD pair to the 0.5885 area, where the demand zone is located.
A detailed analysis of this instrument with reasoning based on the assumptions of the PA+MACD strategy during the live sessions , schedule:
LIVE EDUCATION SESSIONS
This WEEK (5-10 June) I am pleased to invite you to several online sessions. Below is the schedule of meetings:
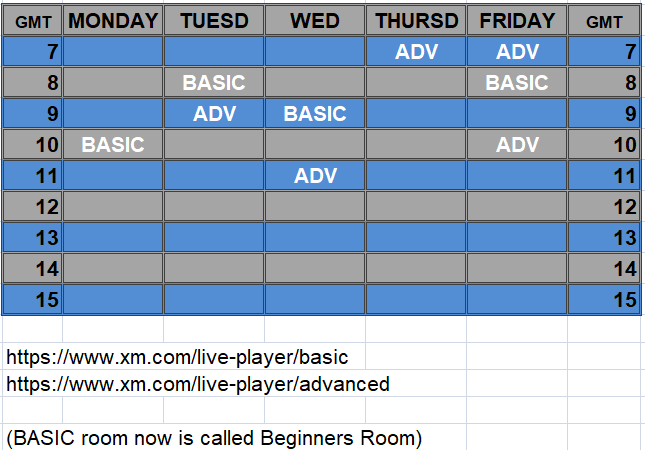
Links: BASIC (beginners room) ADVANCED ROOM
The above analysis is based on the PA+MACD strategy, a detailed description of which you can read HERE . I will talk more about the PA+MACD strategy applied to these currency pairs during the live trading sessions which you can attend from Monday to Friday.
More current analysis on the group : Trade with Dargo


 Review")


