AUDUSD – D1
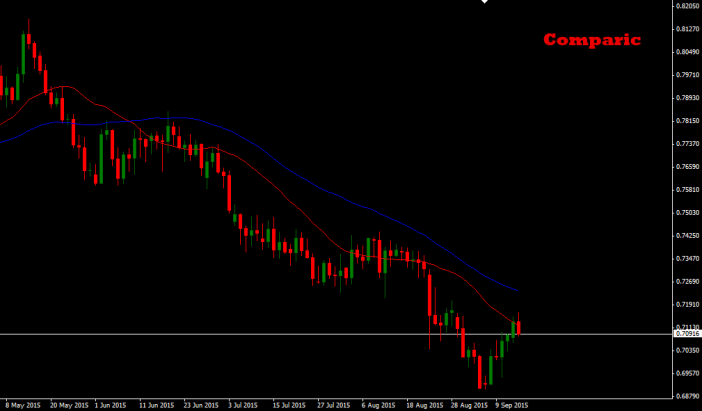
On the daily chart we can notice downtrend. It is easy to identify lower and lower tops and bottoms, we can differ corrections from impulses and we can see that averages have right shape which suggests us opening short positions. Price tested average line. Now we can see Engulfing Bar pattern. Let’s take a look on trading chart.
AUDUSD – H4

On the trading chart we can see that price for some time crossed resistance area. Currently it came back to this area and looking for short positions looks good. There are two confluences on the chart (marked on screen above). Conservative scenario says we should take positions after Pin Bar signal. Remember about money management, don’t use more than 2% of your deposit. Remember about checking correlation table, if this pair is highly correlated with any other, do not open this position.


 Review")


