EURGBP – D1

On the daily chart we can spot bullish trend. We can identify higher and higher tops and bottoms, we can differ corrections from impulses, averages have good shape, what suggests us opening long positions. Currently price is in very interesting place (averages line). Let’s take a look at trading chart.
You can start using Price Action and invest on Forex market using free XM broker account.
EURGBP – H4
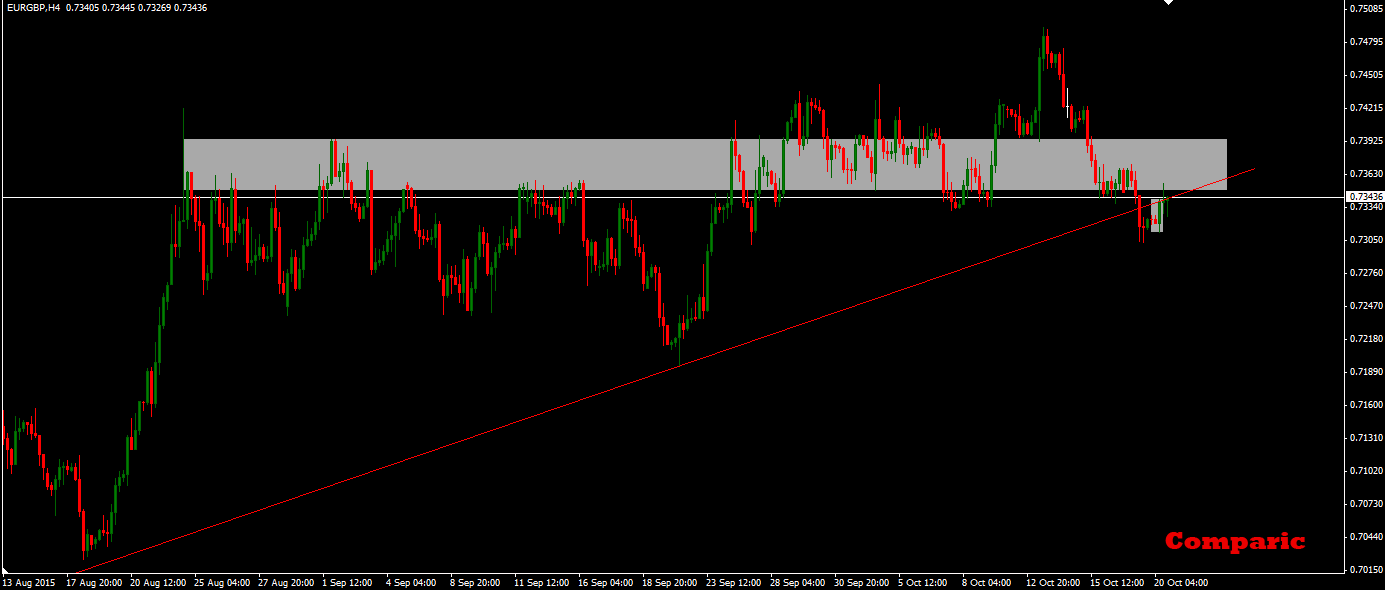
On the trading chart we can see that price is testing support level which coincides with trend line and the base where we saw strong moves. We can also spot the signal of long position. It is Engulfing Bar which suggest us opening long positions. Some brokers use different candles, this is why it is not always possible to spot this kind of signal. Do not risk more than 2% of your capital. Calculate volume of position correctly. Remember about correlations with other pairs, if there will be at least one correlation higher than 0.7 (or lower than -0.7), do not open this position.


 Review")


