GBPJPY – D1
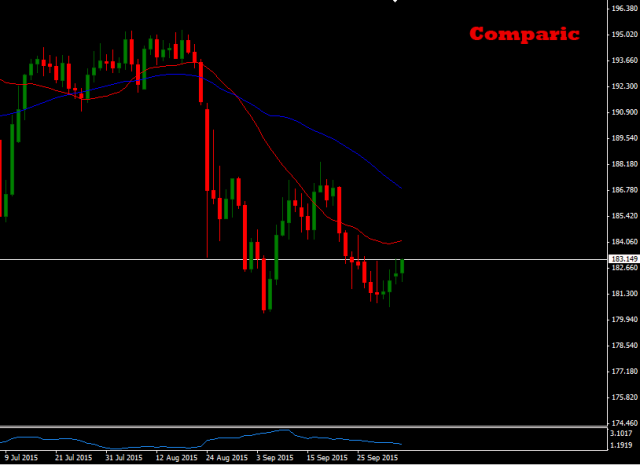
On the daily chart we can spot bearish trend. We can identify lower and lower tops and bottoms, we can differ corrections from impulses, averages have good shape, what suggests us opening short positions. Currently we can see first correction after test of averages line. Let’s take a look at trading chart.
GBPJPY – H4

On the trading chart we can see that there is support created. If the price will break it, good place to open position will be re-test of this area from bottom and waiting for opportunity to open short position. Conservative scenario predicts taking position after candle signal. You can start using Price Action and invest on Forex market using free XM broker account. Do not risk more than 2% of your capital. Calculate volume of position correctly. Remember about correlations with other pairs, if there will be at least one correlation higher than 0.7 (or lower than -0.7), do not open this position.


 Review")


