USDCAD D1
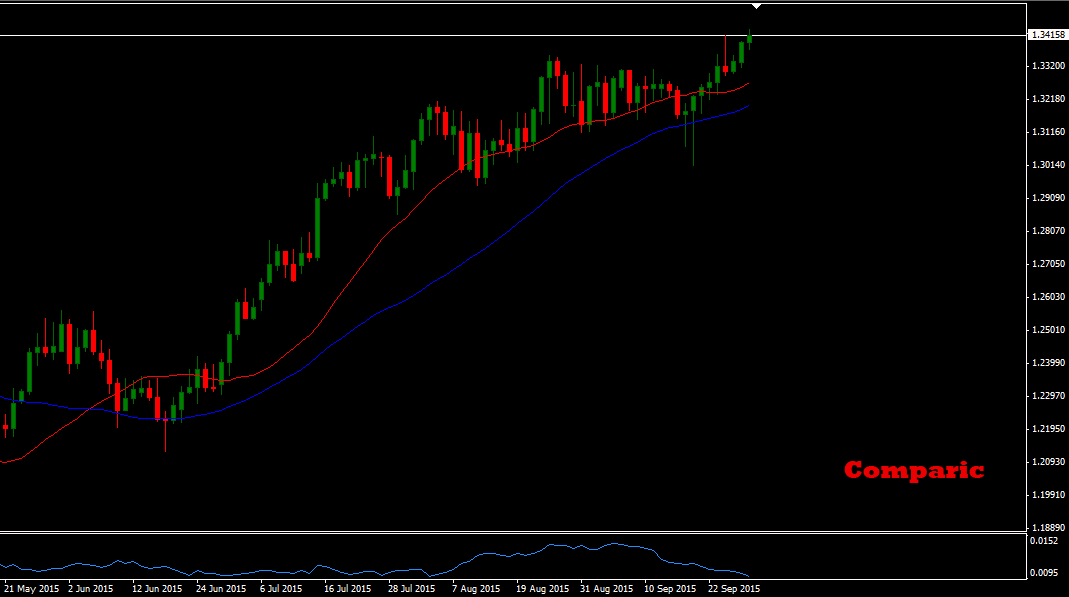
On the daily chart we can spot bullish trend. We can identify higher and higher tops and bottoms, we can differ corrections from impulses, averages have good shape, what suggests us opening long positions. On the daily chart we can see new high. Let’s take a look at trading chart.
USDCAD H4
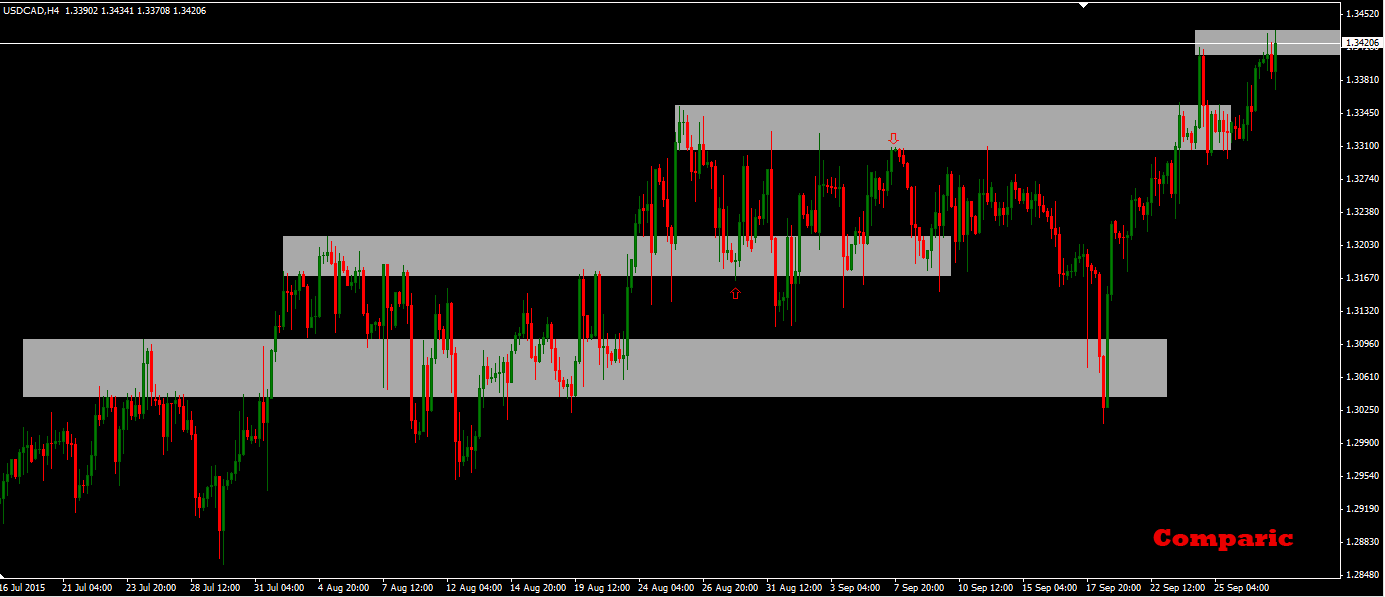
On the trading chart we can see that price realized scenario from the previous analysis. Now pair is probably creating new resistance zone, which should be good place to open long position. Support area is still a good place to go long according both to conservative and aggressive scenario. Conservative scenario predicts taking position after candle signal. Do not risk more than 2% of your capital. Calculate volume of position correctly. Remember about correlations with other pairs, if there will be at least one correlation higher than 0.7 (or lower than -0.7), do not open this position.


 Review")


