USDCAD – D1
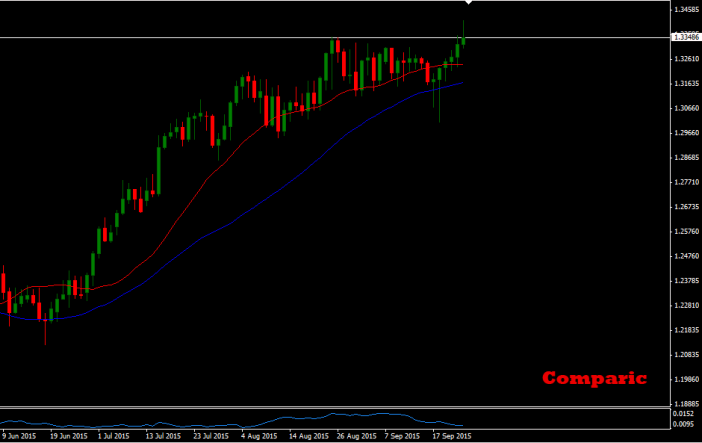
On the daily chart we can spot uptrend. We can identify higher and higher tops and bottoms, we can differ corrections from impulses, averages have good shape, what suggests us opening long positions. On the chart we can see strong marubozu, which was created after reversal bar. Let’s take a look at trading chart.
USDCAD – H4
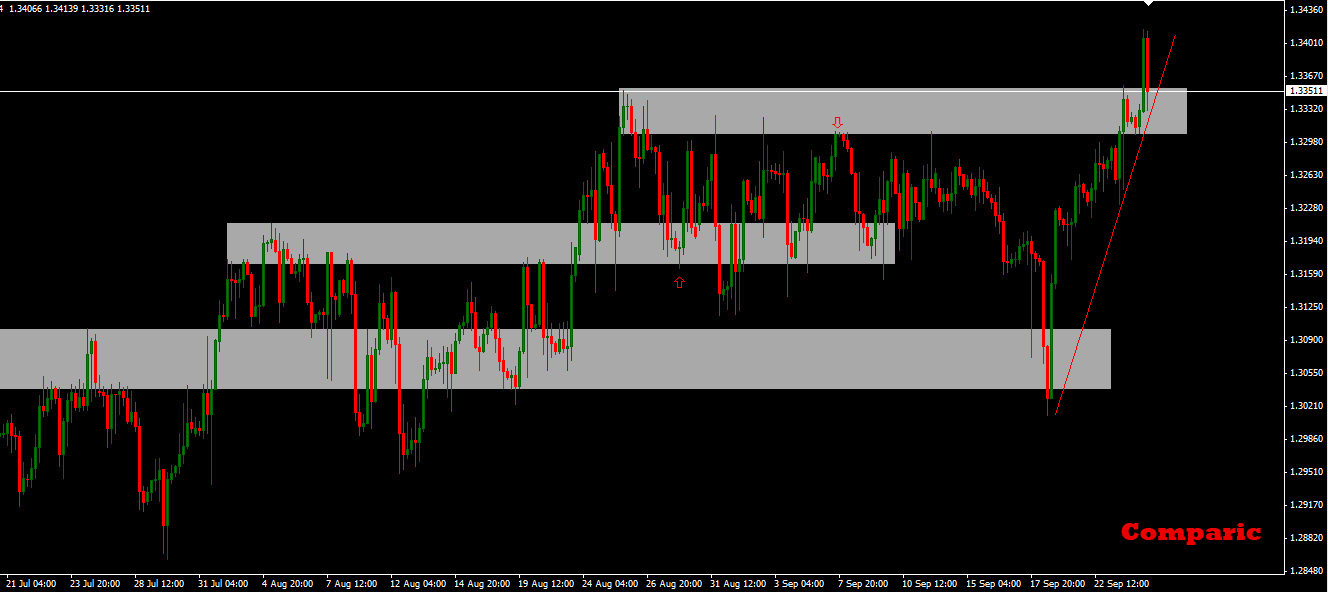
On the trading chart we can see that price breached important resistance area. We can see that trend is getting stronger and should not end soon. Currently price is testing middle of area which is connected with confluences on the chart. We can set dynamic trend line and see base on the left side of the chart. Conservative scenario predicts opening positions after candle signal. Do not risk more than 2% of your capital. Calculate volume of position correctly. Remember about correlations with other pairs, if there will be at least one correlation higher than 0.7 (or lower than -0.7), do not open this position.


 Review")


