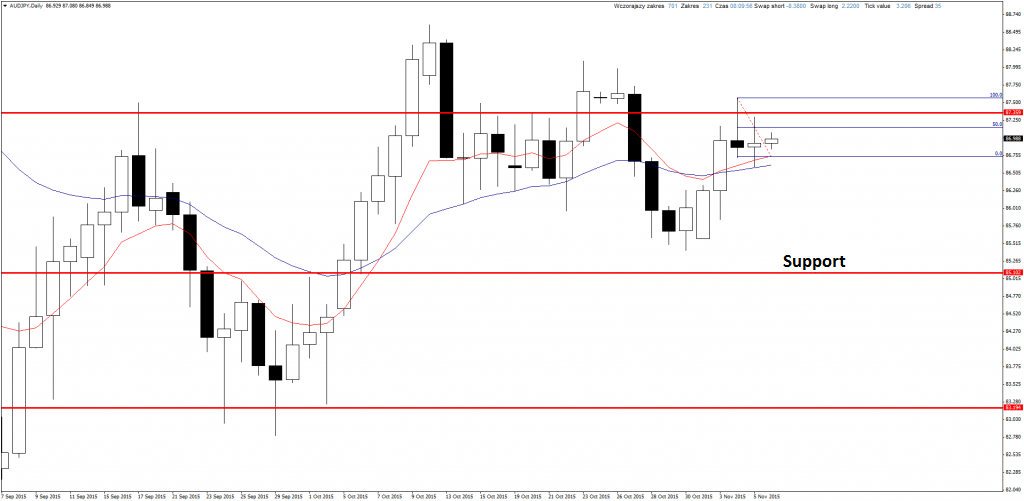
AUDJPY
Resistance was tested and on D1 there was Pin Bar candle. Yesterday 50% retracement of this candle was tested and now I have short opened. Stop Loss is 50 pips and Take Profit 160 pips.
If you are interested in Price Action Strategy description, you can read it here.
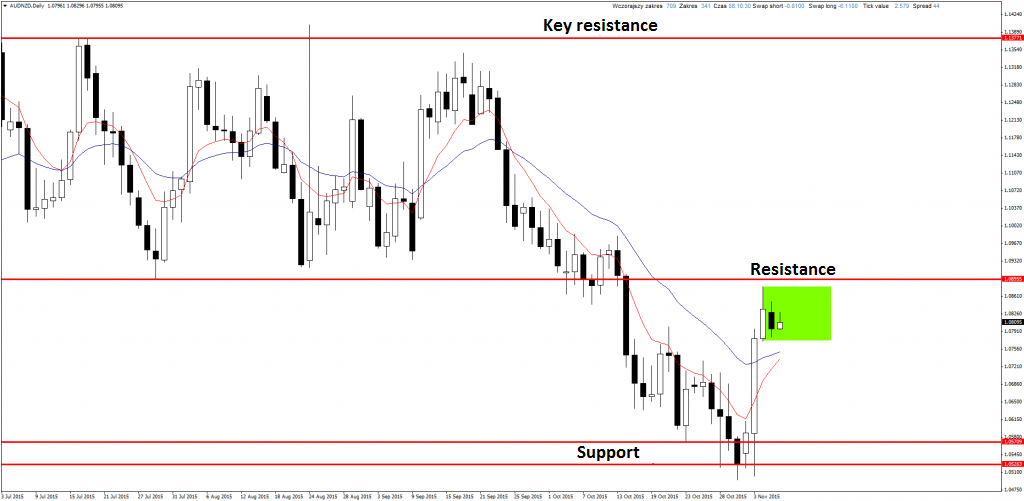
AUDNZD
Here I spotted Inside Bar close to resistance. Now there are 3 possible signals, 2 shorts and 1 long:
Shorts:
False breakout, going back to range and we can open position with price market and Stop Loss above breaking candle.
Correct break below and close of the daily candle below signal candle. Then I will open pending order on 50% retracement and SL above it.
Long:
Correct break above and close above Inside Bar and resistance, Then I will set buy limit order on 50% retracement of signal candle and SL below it.
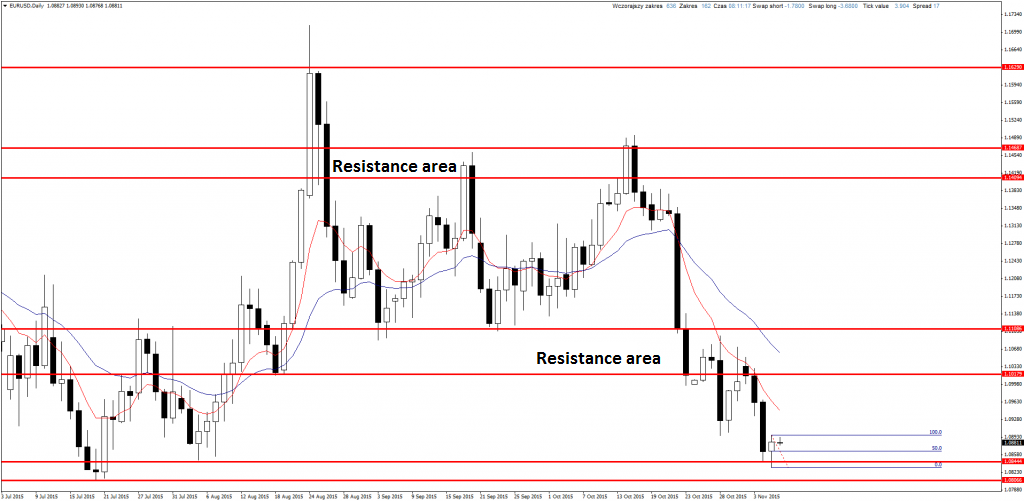
EURUSD
Buy signal on this pair. It is D1 Pin Bar on support. Not so long time ago I had short position with target on this level.
Signal is against trend but it can be beginning of longer correction. SL is 40 pips and TP 160 pips so I think it is worth risk.
YOU CAN START USING PRICE ACTION AND INVEST ON FOREX MARKET USING FREE XM BROKER ACCOUNT.
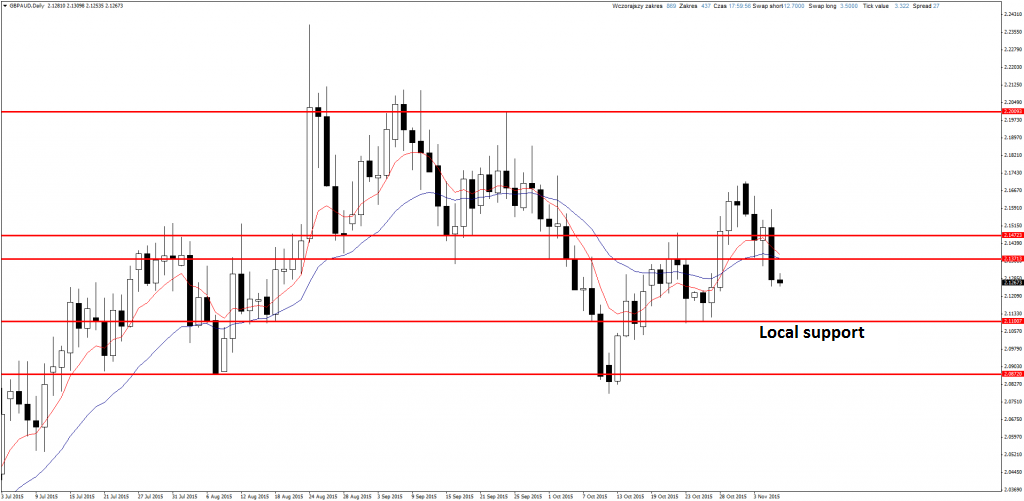
GBPAUD
Long position was closed quite fast yesterday but it was already secured on BE. Strong move after yesterday BoE brought this pair below support. It changes sentiment to bearish and if there will be bullish correction t this level and it will be tested from bottom with H4 or D1 signal at the same time, we can open short positions.
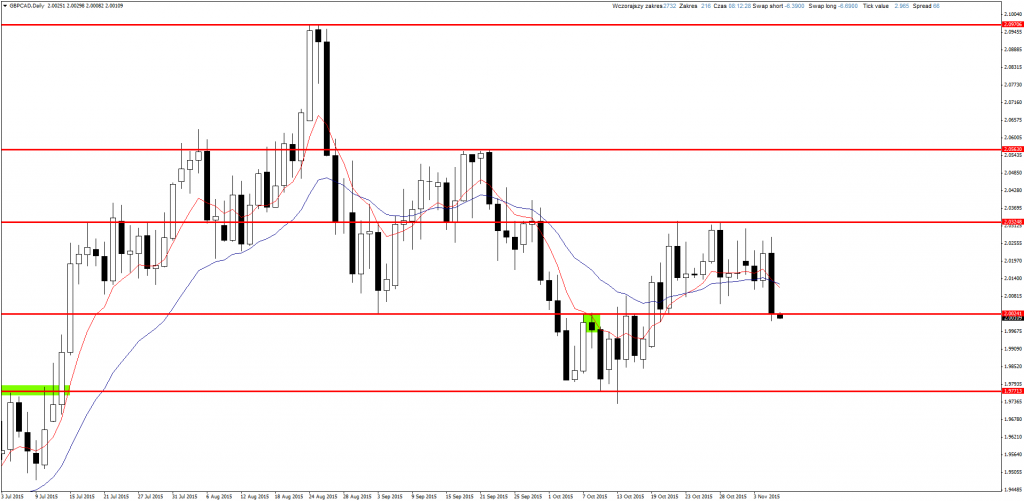
GBPCAD
Support is not broken on this pair. Still there can be a rebound and level will be respected. For now I look for chance to open long position.
GBPCHF
Similar situation on this pair. I’ll remind, yesterday I had long position which was closed on TP just few hours before pound weakened. Now there is still opportunity to look for long position.

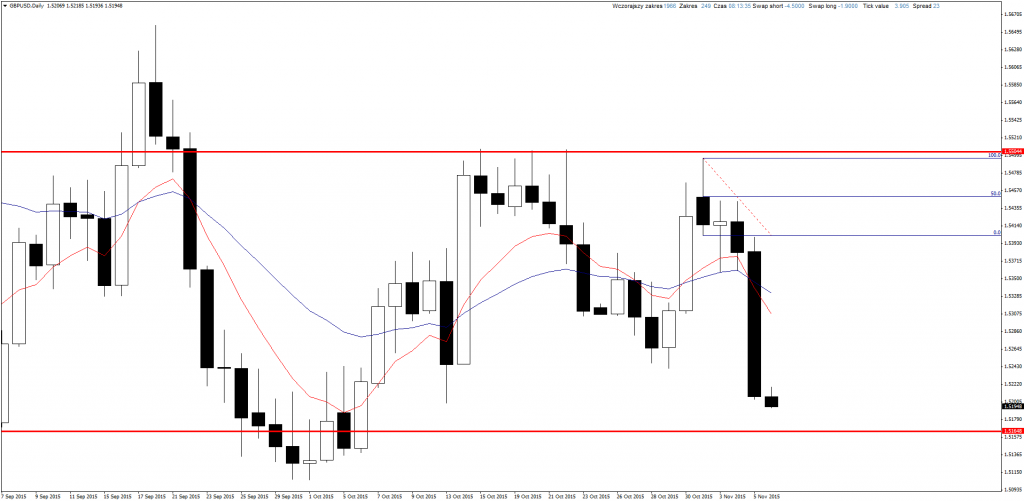
GBPUSD
A little bad luck here. Pending order was not opened, there was a lack of just 1 pips and yesterday I could reach TP pretty fast. Well, it is just part of trading.
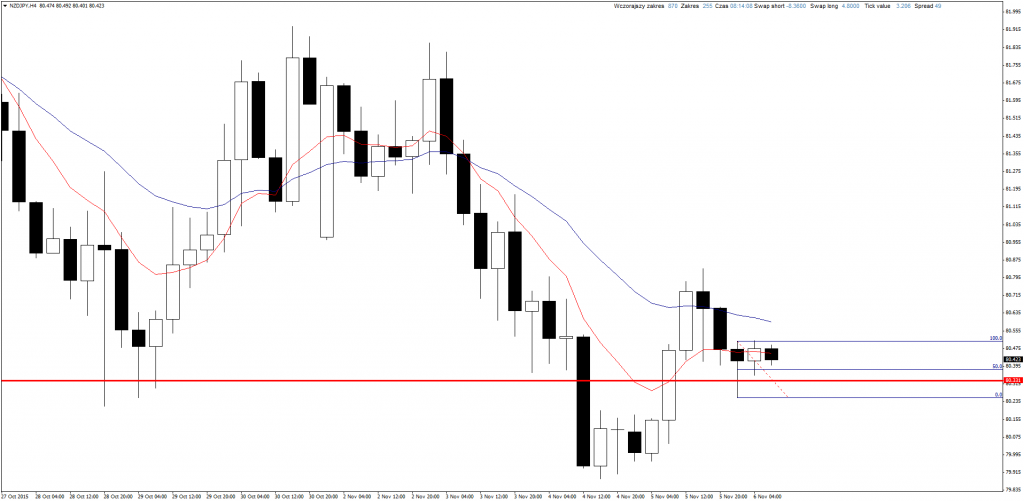
NZDJPY
Yesterday on this pair we could see change of sentiment to bearish after breaking support. However chart didn’t confirm that and I just react for price behavior. Price came back above support and tested it successfully. We can see Pin Bar on H4 which is buy signal and chance to open long position.
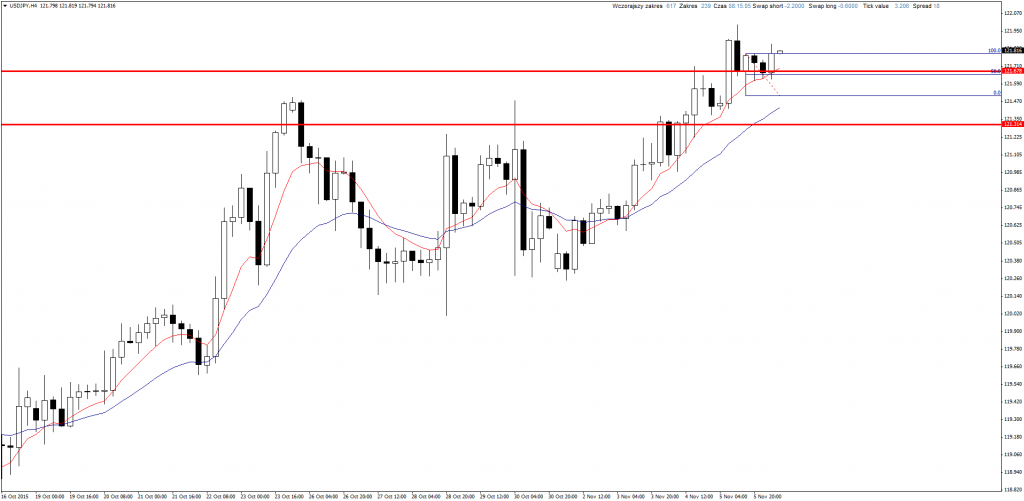
USDJPY
Similar situation here. Resistance was broke, correction showed that it changed to support and there is buy signal on H4.


 Review")


