Today I present quite big Price Action Daily Setups. Don’t worry that they are being published quite rarely for some time (especially during holidays) because it is not the best time for trading.
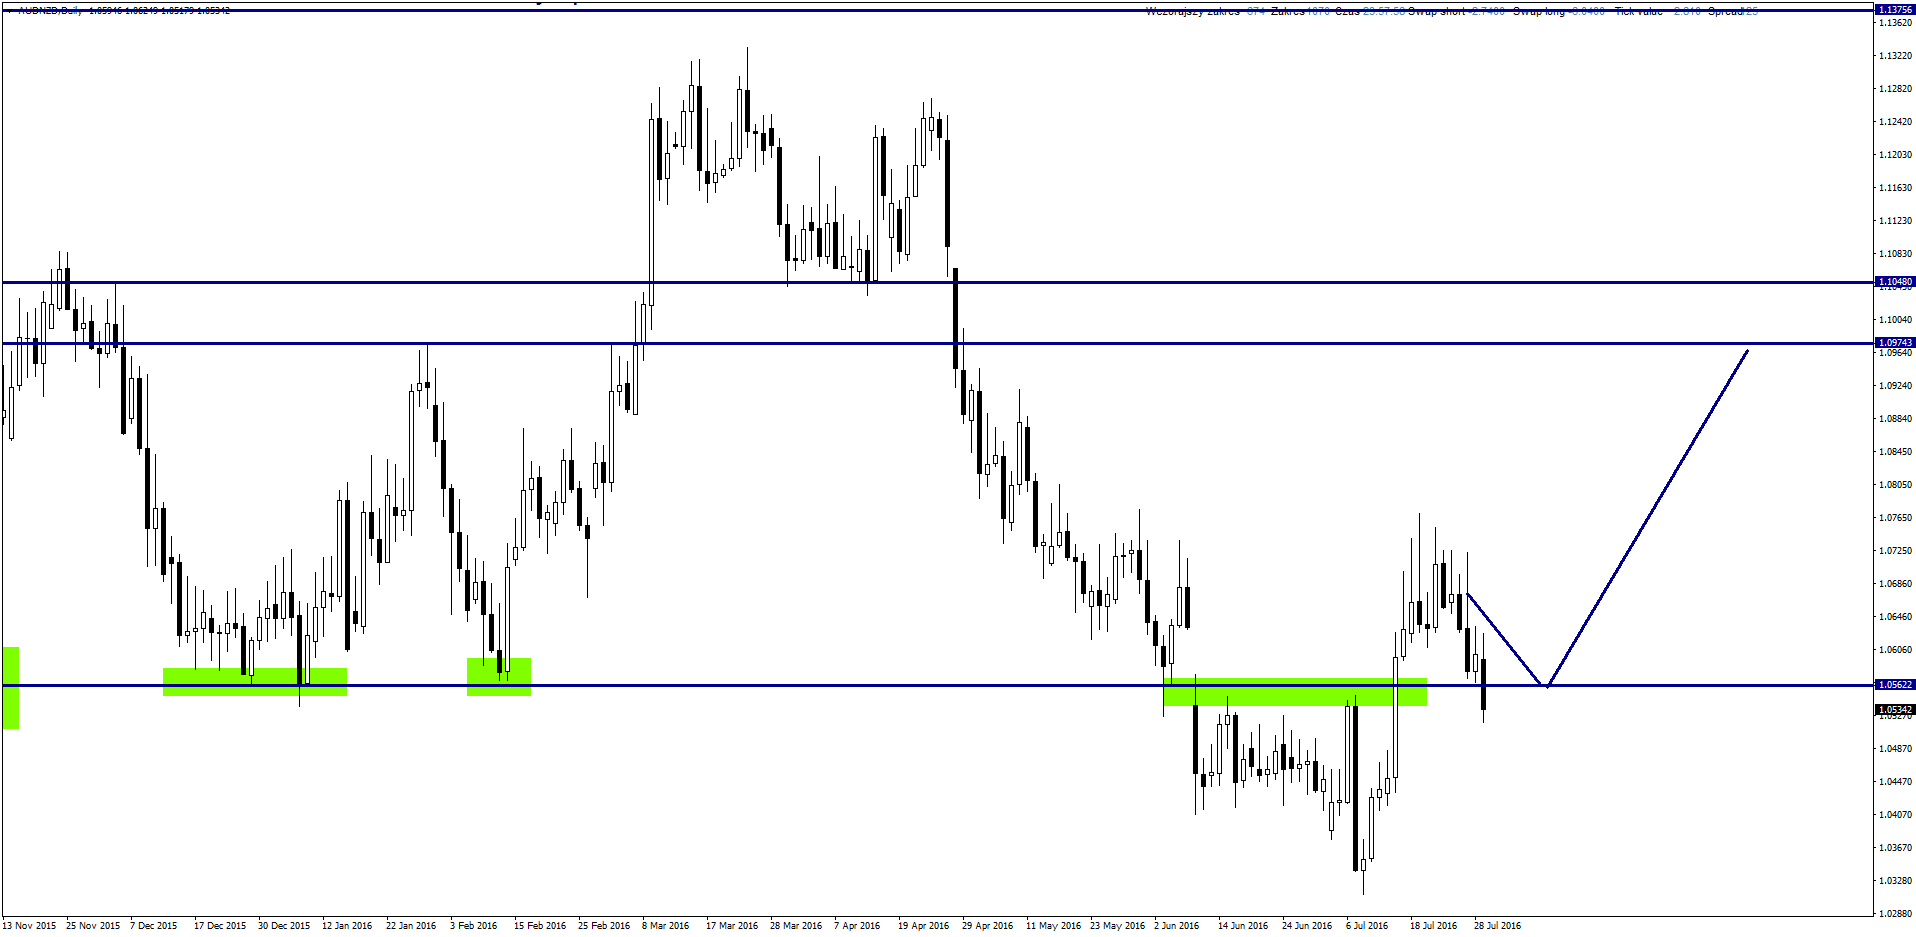
AUDNZD
Pair is right now above key support level. On Friday it decreased below it and it can be a signal for further losses. Of course it can be a false break and there may be some gains in the nearest time. I can see two scenarios:
- False break. Price Action buy signal on the daily chart and we can open longs.
- Bullish correction will show up and there will be sell signal near support/resistance and we can open shorts.
If you are interested in Price Action Strategy description, you can read it here.
EURJPY
Pair decreased below support and scenario is the same as in the pair above – long position after buy signal or permanent break and looking for short position.

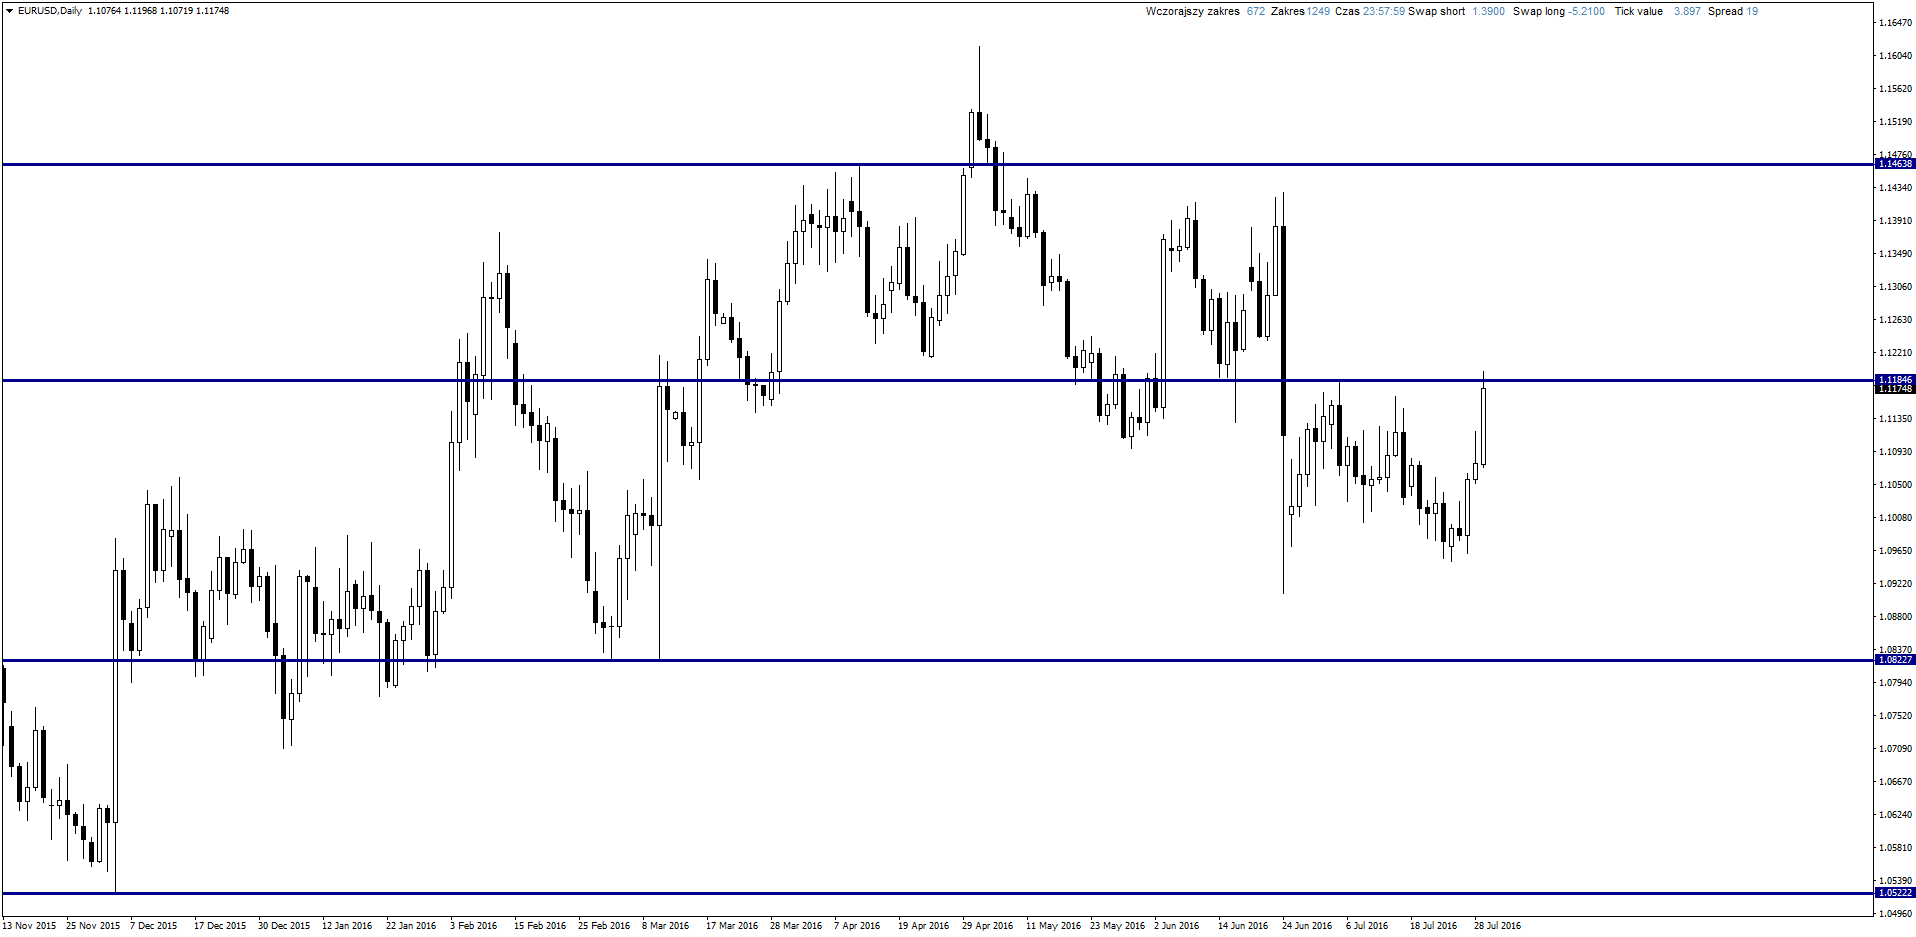
EURUSD
It reached resistance area. Trend is bearish since beginning of May so I will look for sell signals. It need to be on daily chart because for 3 sessions there is appreciation so short term trend is bullish.
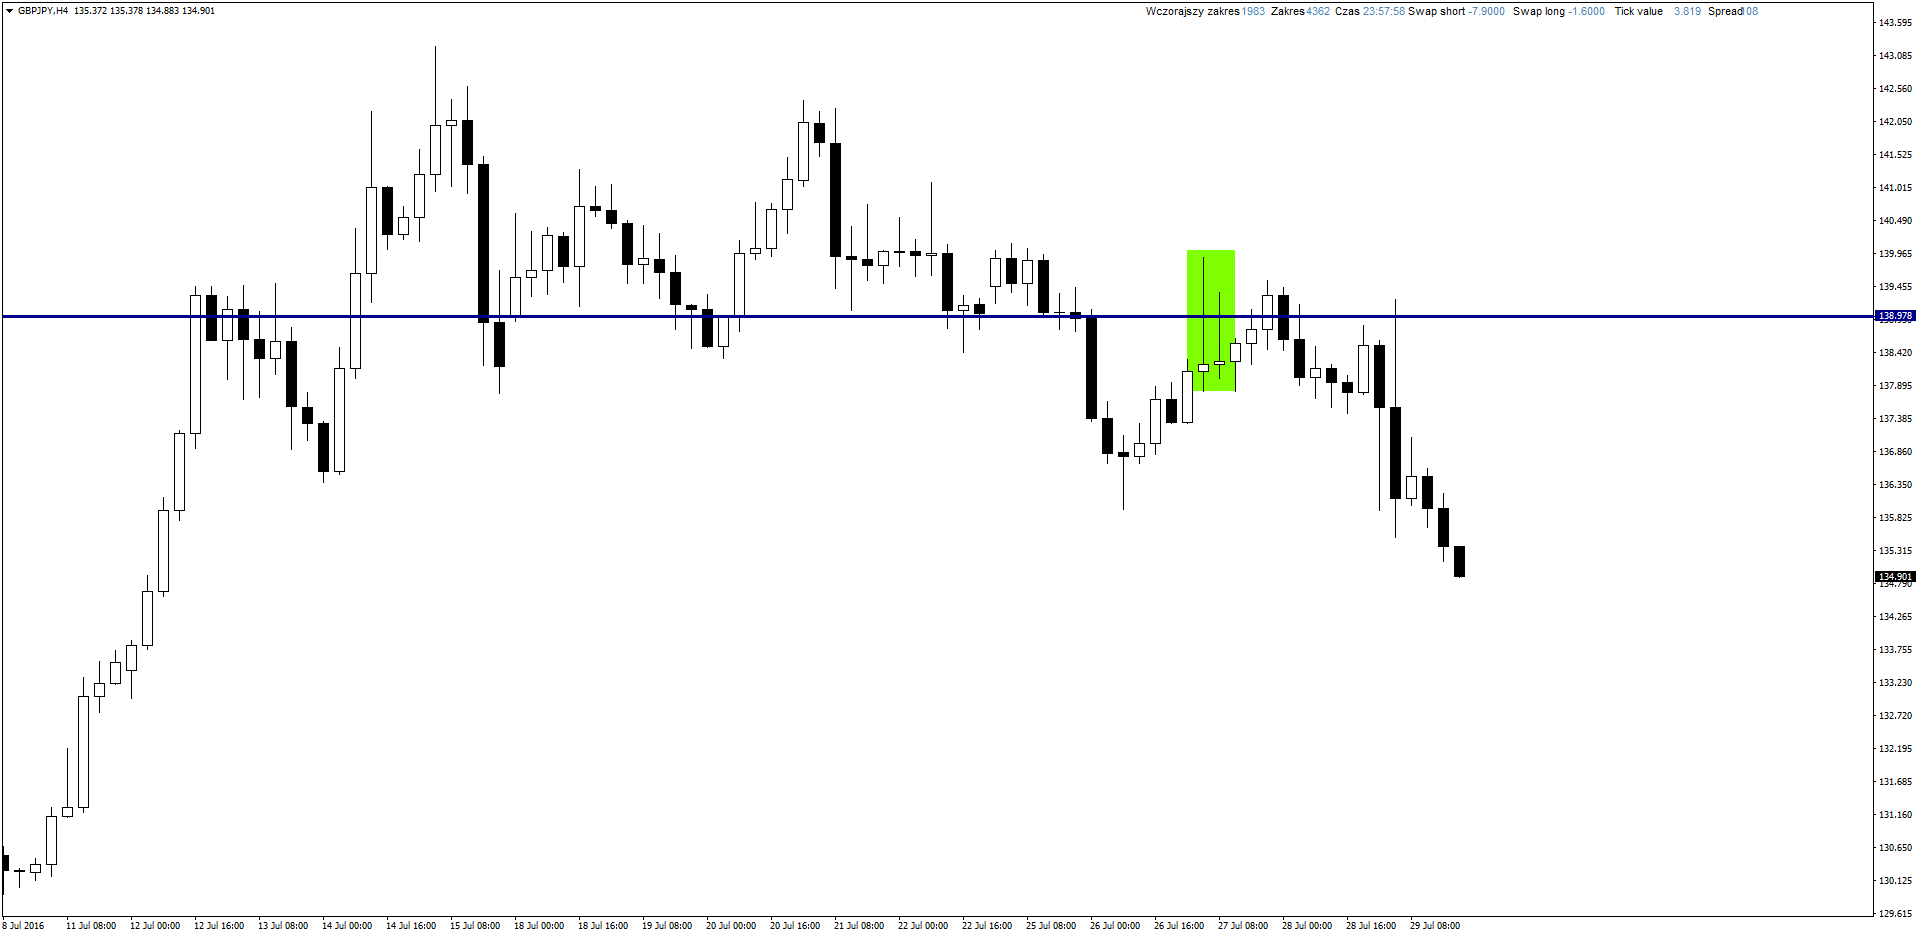
GBPJPY
Pairs with Pound are still in very dynamic bearish trend and it looks like sell out didn’t end yet. I still wait for test of resistances and possibility to open short position and on this pair I already have opened one. I marked really good sell signal in form of Pin Bars. So far I have 400 pips of profit and I wait for another 400.
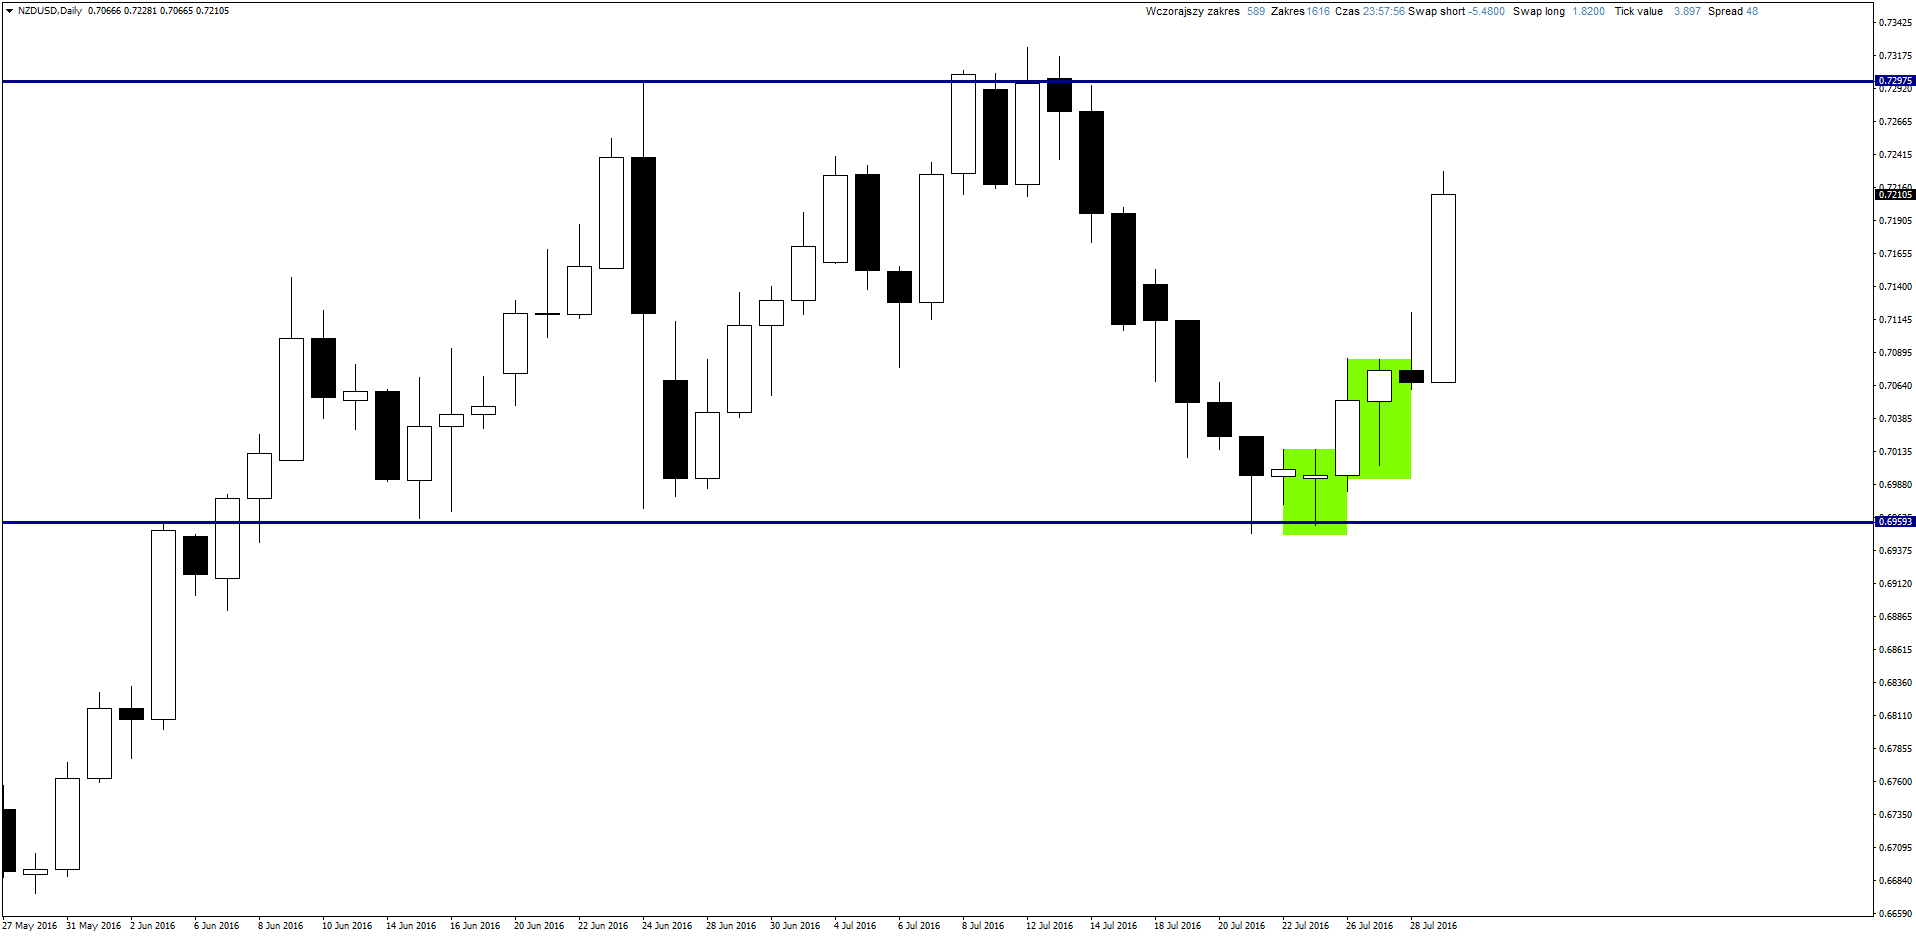
NZDUSD
Very nice Pin Bar showed up on support but price went up really quick. It happened in the middle of the night so I didn’t manage to open long position. I have waited for bearish correction and it showed up day later. My position has 60-70 pips of Stop Loss and so far it has 200 pips of profit.
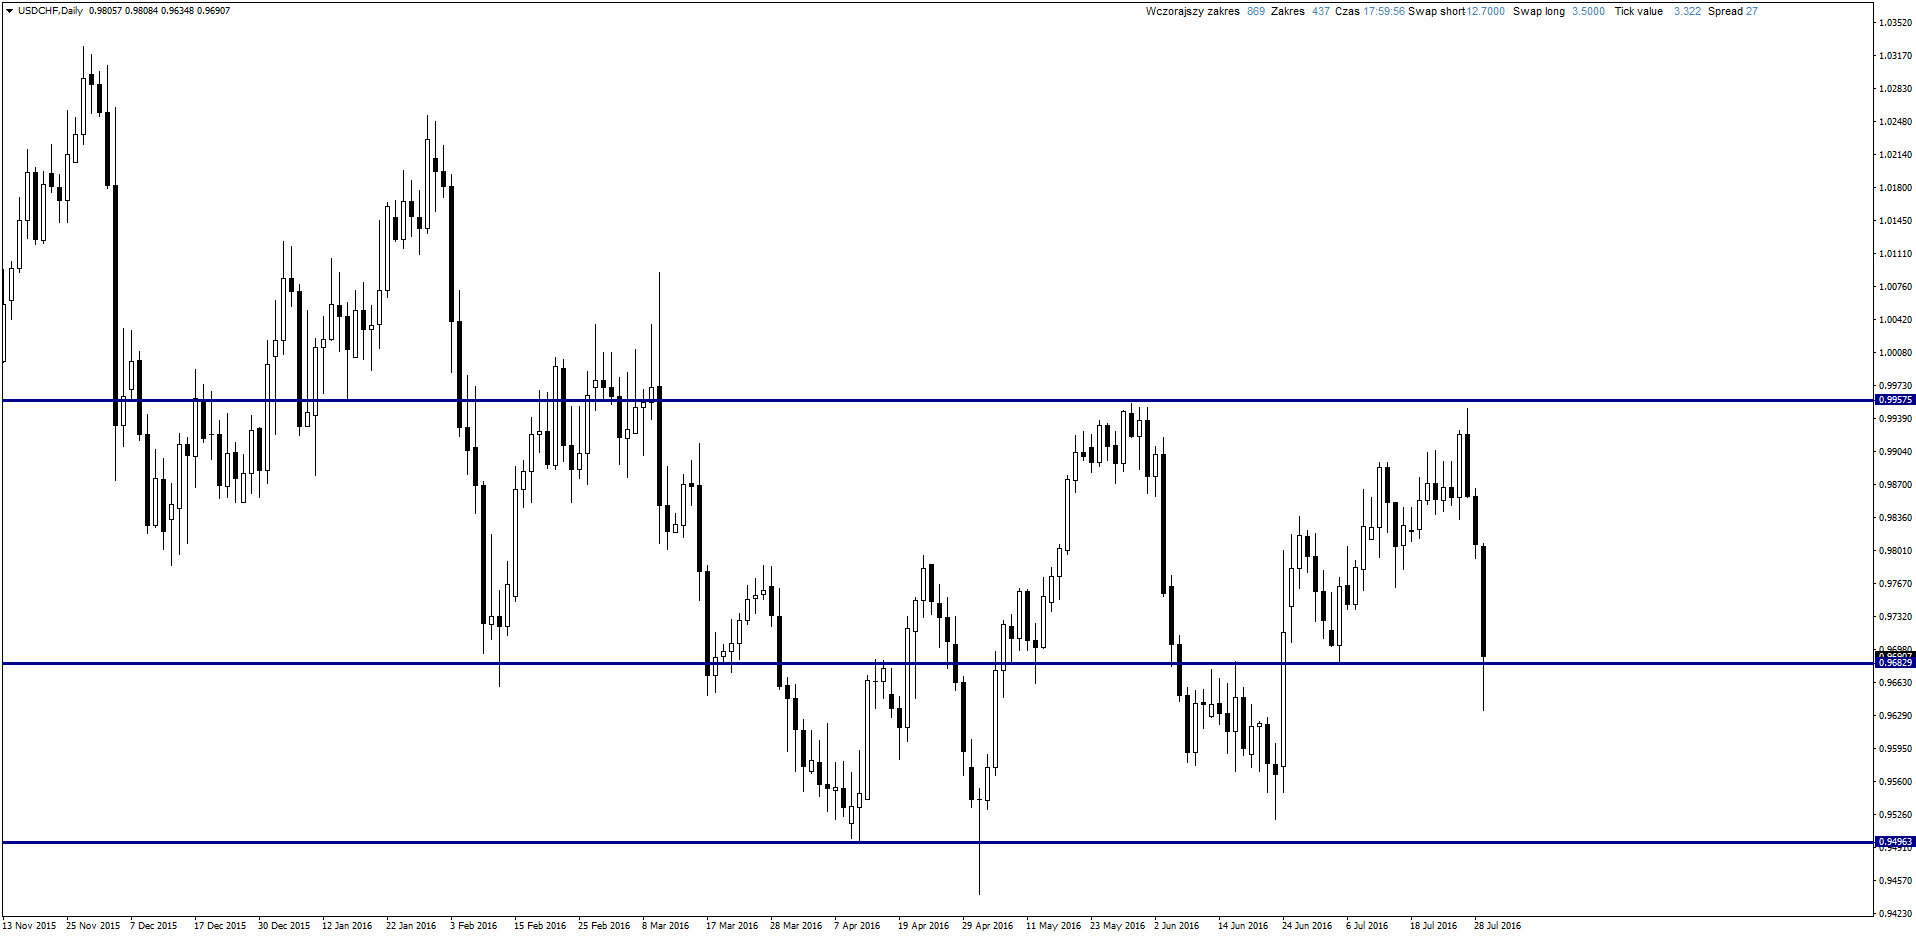
USDCHF
Behaviour of this pair is a confirmation that markets are technical again. Rebound form support, reaching resistance and quick drop to support again. Now I will look for buy signal and if it will show up I will open longs. On H4 chart we can see really big Pin Bar which I can assume is a signal. If there will be any decrease letting open long position with small SL I will consider that scenario.
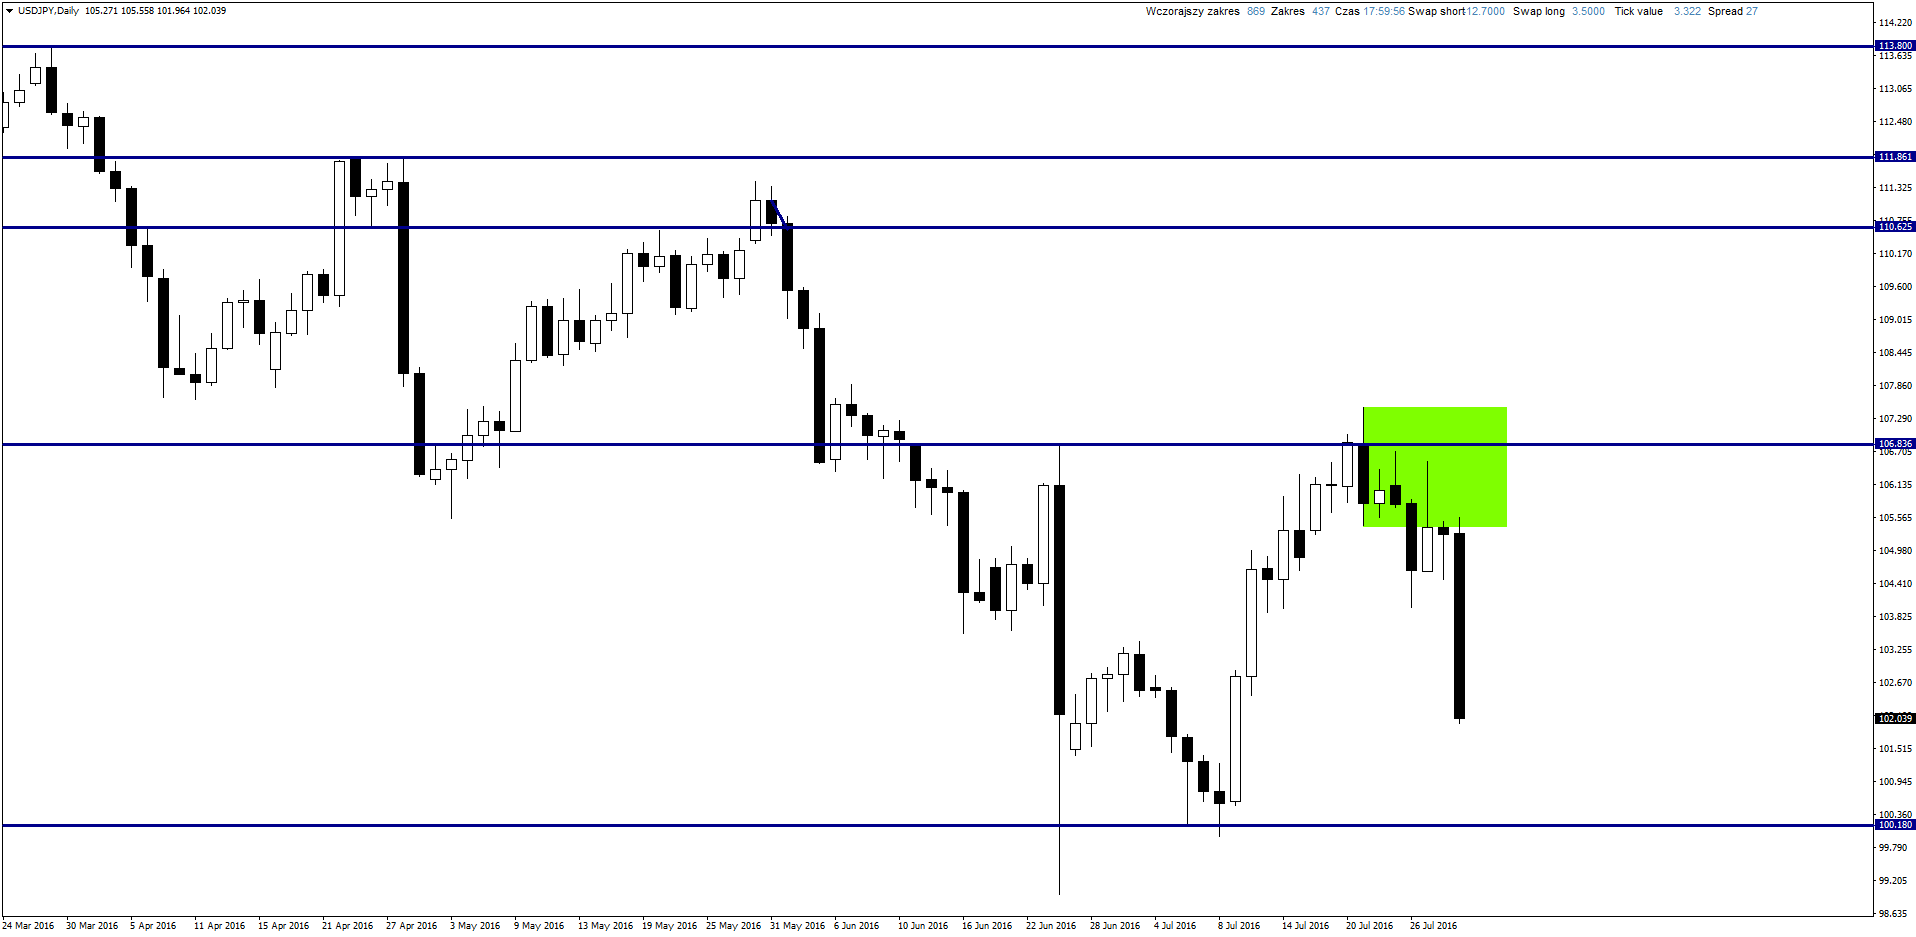
USDJPY
Inside Bar showed up on this pair, then there was break below and we could open short position. I was a little late and I have opened it on daily candle – 100 pips SL and 350 pips TP.
YOU CAN START USING PRICE ACTION AND INVEST ON FOREX MARKET USING FREE XM BROKER ACCOUNT.


 Review")


