AUDUSD
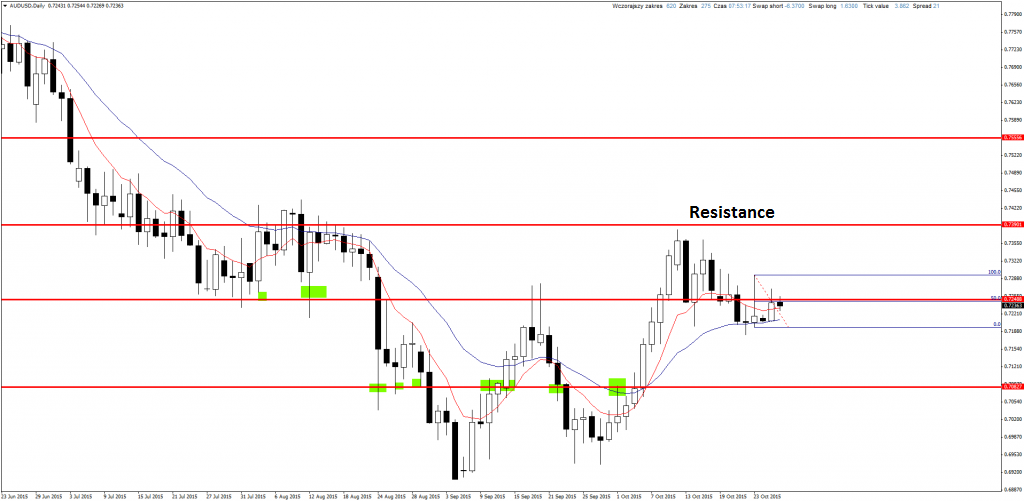
Local support has been broken then there was re-test and on D1 chart we can see big Pin Bar. Currently 50% of retracement is tested what you can see on the screen. I opened short yesterday already because it looks solid and it is consistent with strong bearish trend which is without doubt on this pair. SL a little more than 50 pips and TP around 150 pips. It is not perfect RR but lately these positions end mostly with profit.
EURUAD
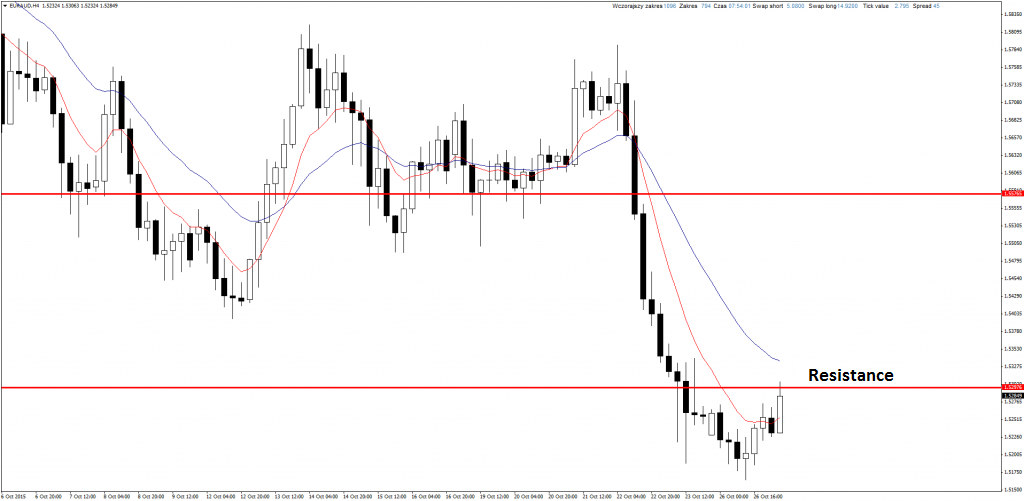
On the chart we can see strong bearish impulse, on H4 there are 10 black candles in the row which brought price below key support. Now this level should turn into resistance and test of it should be opportunity to open short position. We just have to be patient and look for some sell signals.
If you are interested in Price Action Strategy description, you can read it here.
EURCAD
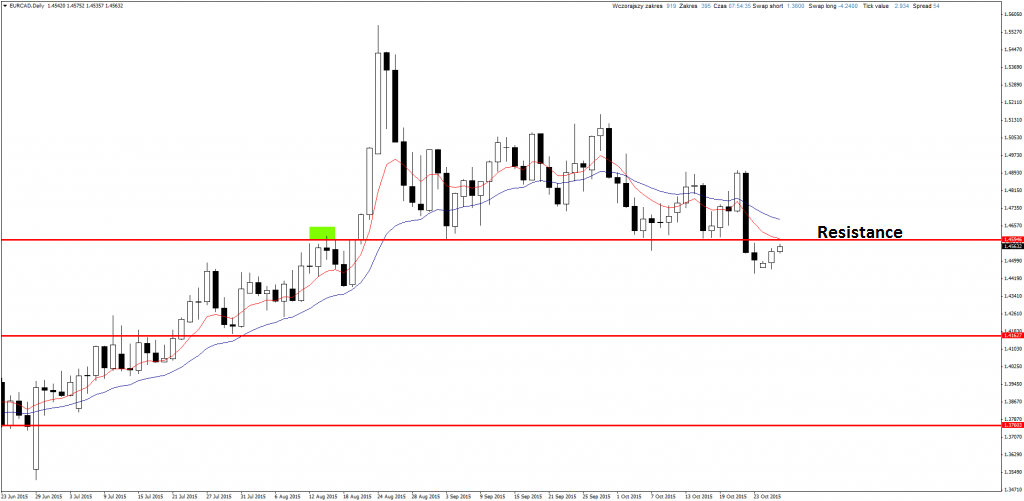
Similar situation here. We should also watch price behavior during test of former support (now resistance) and open short positions. Euro has obviously big pressure so selling it looks like a good idea.
YOU CAN START USING PRICE ACTION AND INVEST ON FOREX MARKET USING FREE XM BROKER ACCOUNT.
GBPCHF
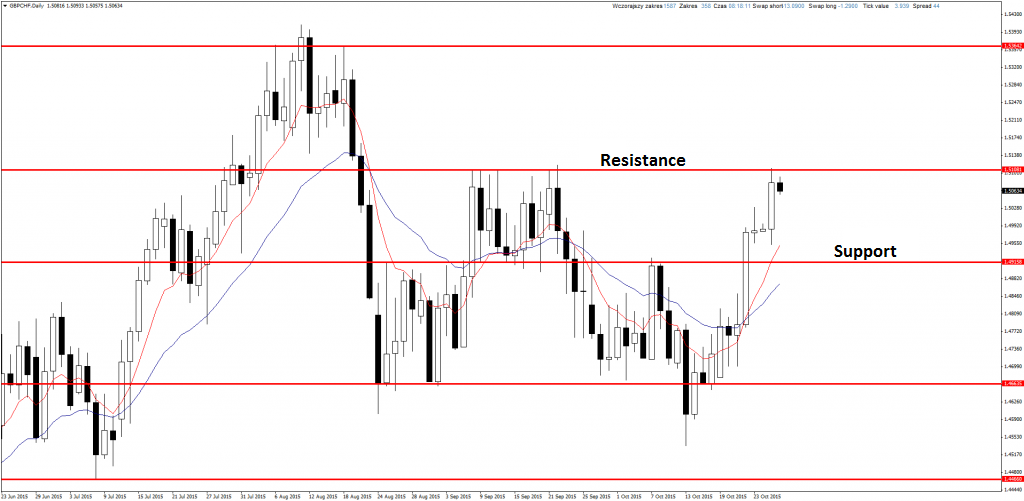
This pair increased last week and reached very strong resistance. You can see on daily chart that this level was tested 7 times already in very short time. If you consider last bullish impulse it can be finally broke. Now we have to think about possible scenarios.
The first one is breaking the resistance and opening long positions according trend. Second one is rebound of resistance and waiting for bearish correction, during which I will look for opportunity to open long position.
NZDUSD
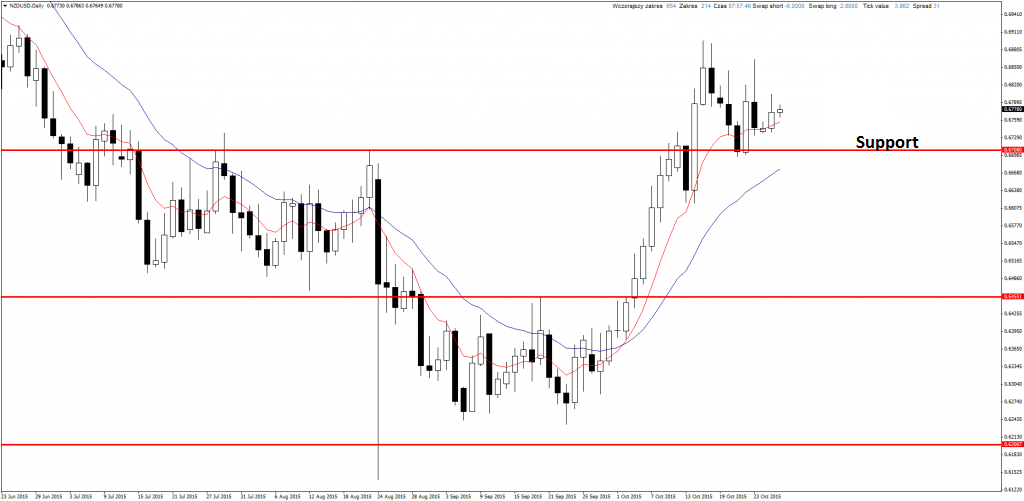
I still wait for another test of support. If price start to decrease, I will look for buy signal on H4 chart because long positions will be consistent with trend on this pair.
USDCHF

This pair is closed in wide consolidation and price is currently getting close to its upper band. The most possible scenario is test of this level and decrease in direction of support. To open position, we need clear signal on the daily chart.
USDJPY
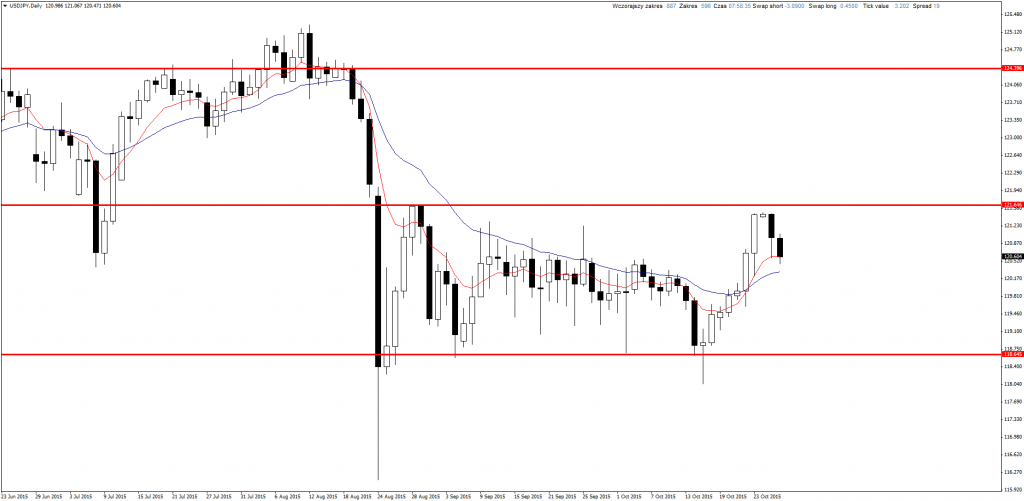
This chart looks very strange. After long side move there is more dynamics but price is still in horizontal trend. Only after breaking we can look for short or long positions, depending on the direction of break.


 Review")


