Today a little more pairs because I see some potential signals and situation can be interesting. There will also be I reminder of Cable position and little digression about managing opened position.
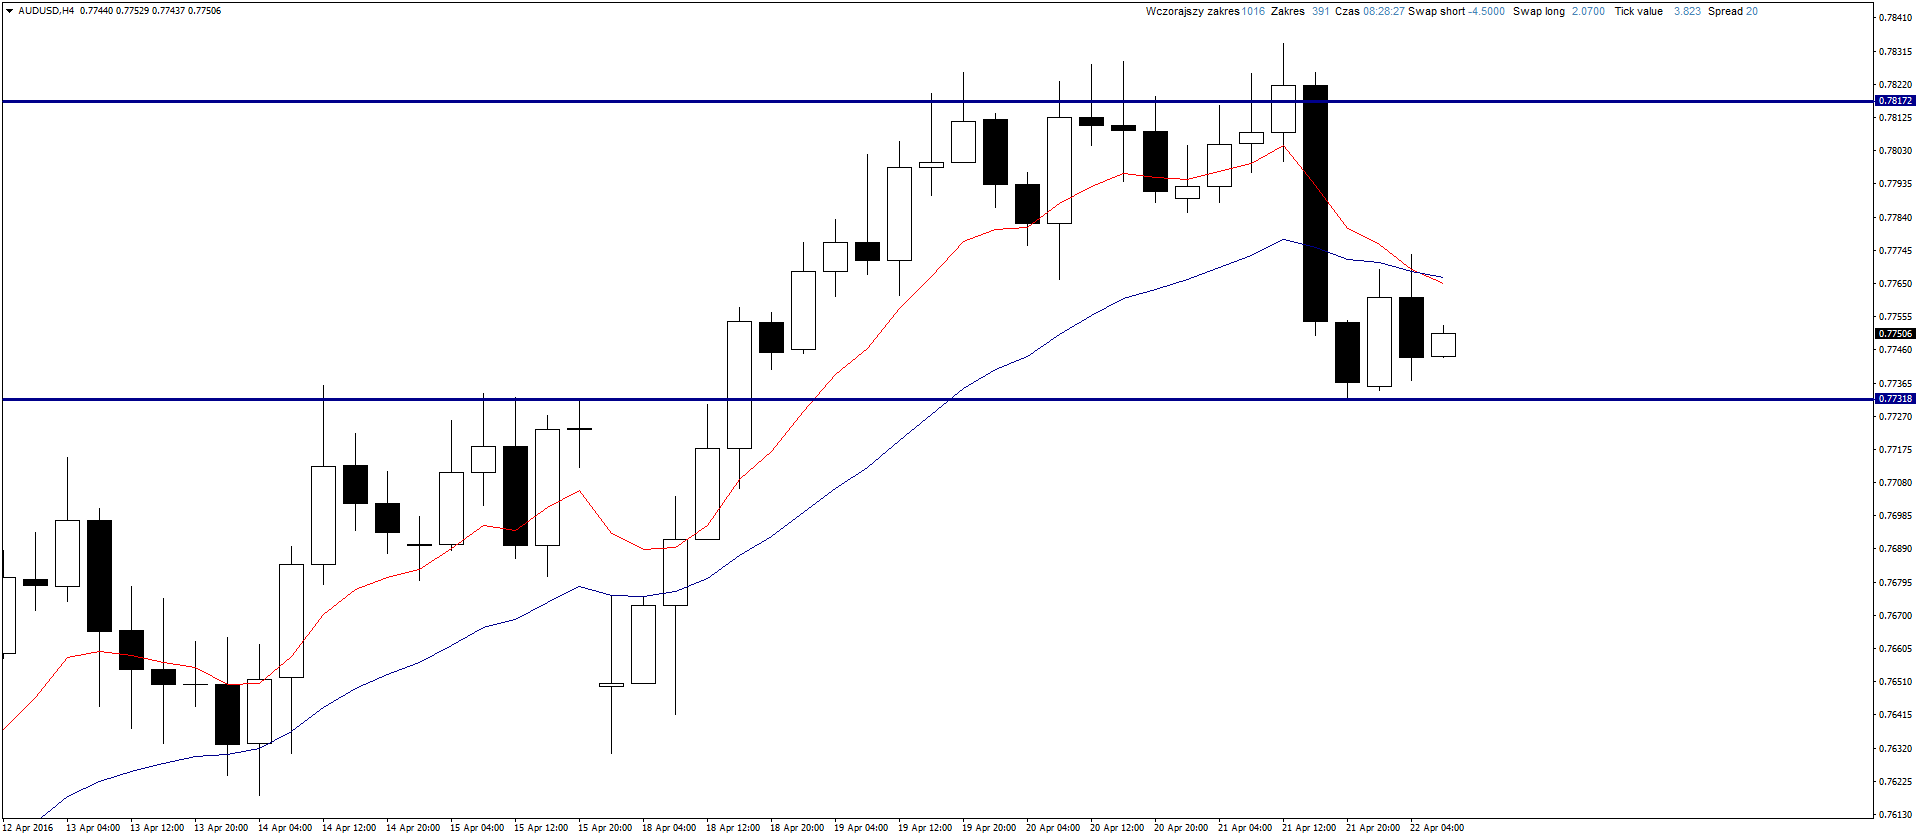
AUDUSD
Aussie didn’t managed to break resistance and dropped to support area. We can consider opening long position, trend is clearly bullish lately and commodities are appreciating. I will watch H4 chart looking for Price Action buy signals.
If you are interested in Price Action Strategy description, you can read it here.
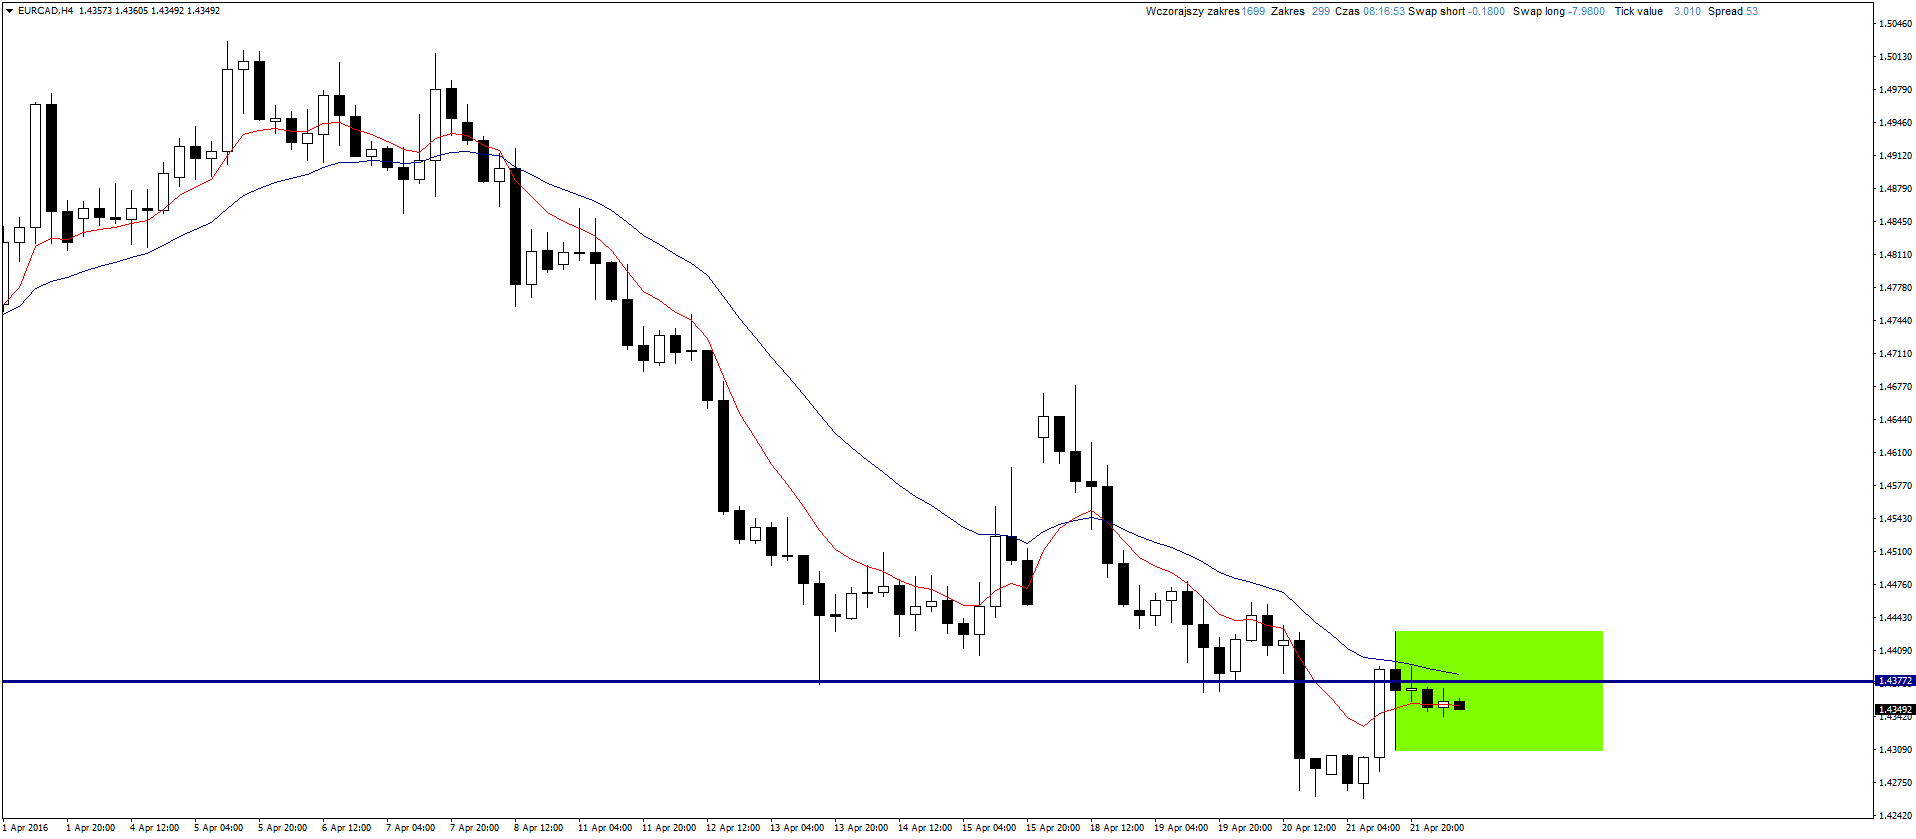
EURCAD
This pair dropped below support. It will mean that it is worth to look for signals to open short positions during re-test of mentioned level from below. As you can see Inside Bar created on the chart. I see 3 possibilities to open position:
- Break below and close below mother candle (range set on green on the chart). Then we can set sell limit order on 50% retracement of signal candle with Stop Loss above it.
- Break below, come back to mother candle range and close within it. Then we can open long with market price and SL below signal candle.
- Break above and close above mother candle. It will be long signal and I will set buy limit order on 50% retracement of signal candle and SL below it.
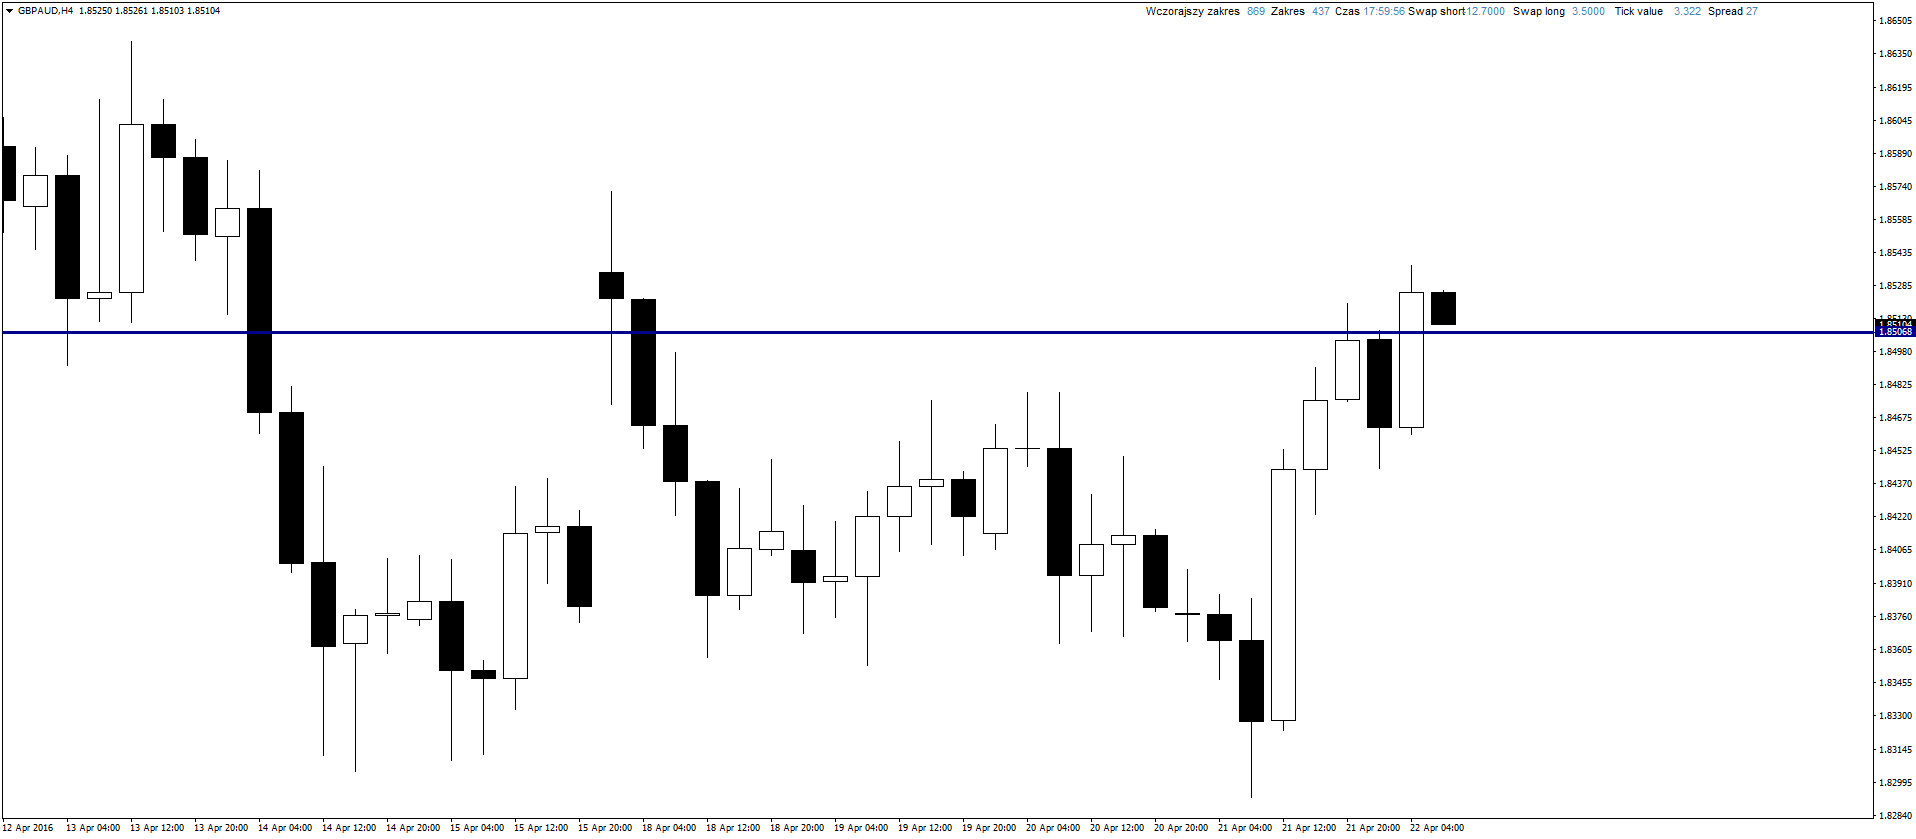
GBPAUD
I will look for short position after any sell signal.
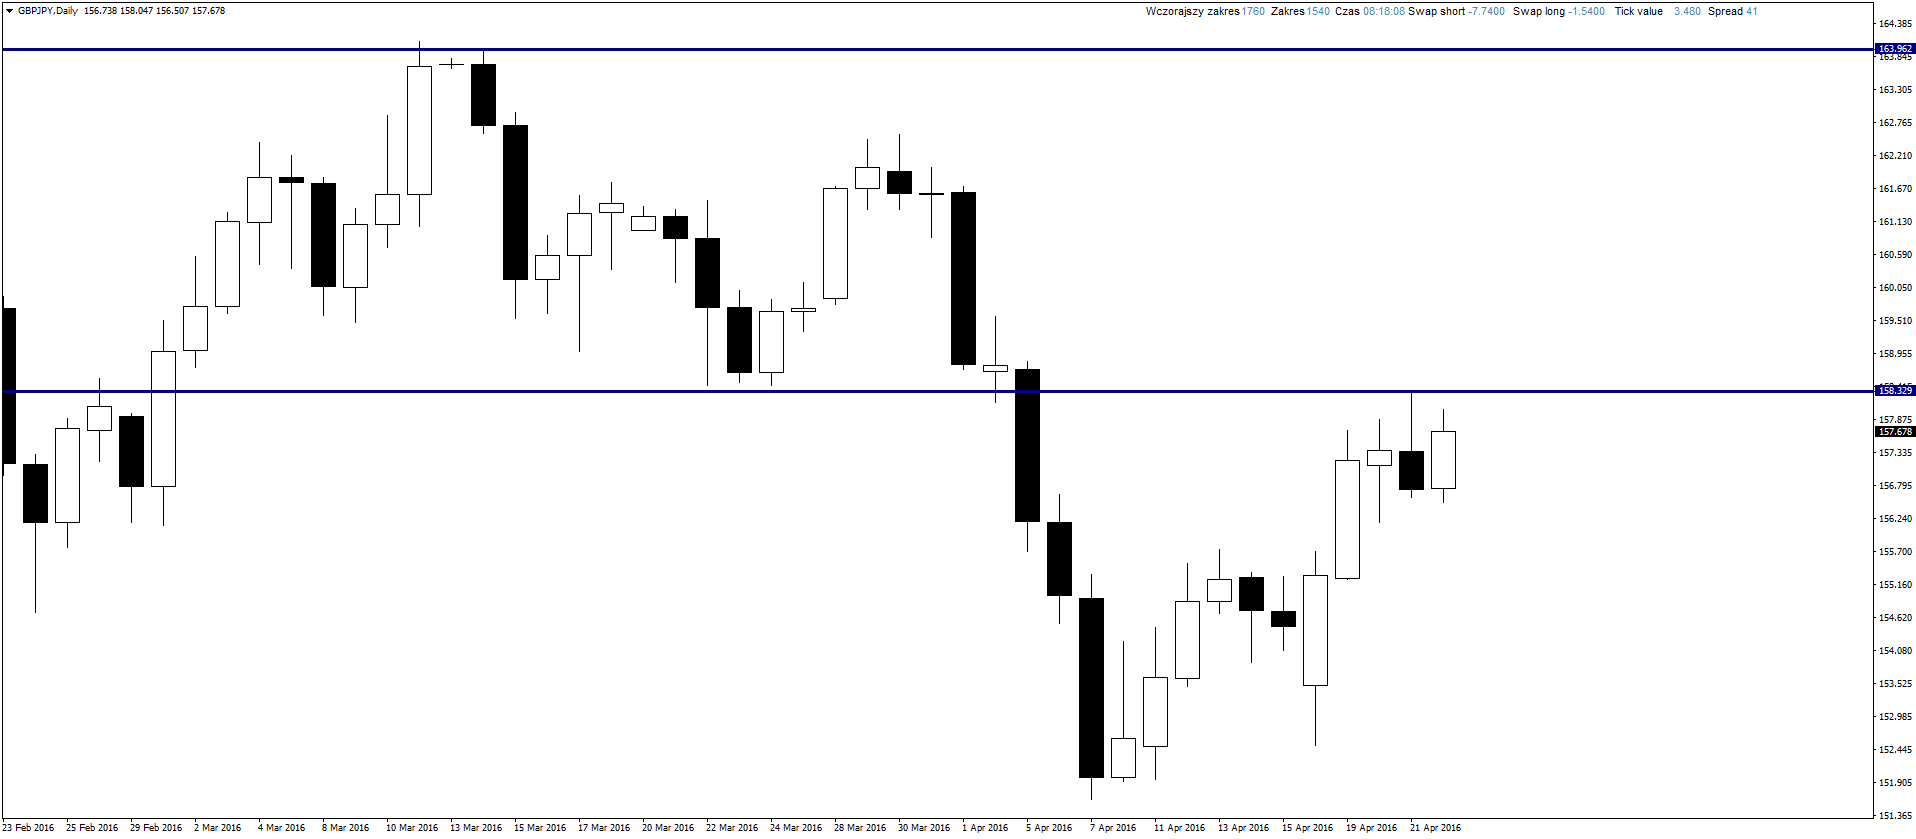
GBPJPY
Quite interesting sell signal on this pair. Clear Pin Bar on D1 chart and at night there was gain which let us open position with 80 pips SL. TP is at least 500 pips – to lower wick of bullish candle 5 sessions back.
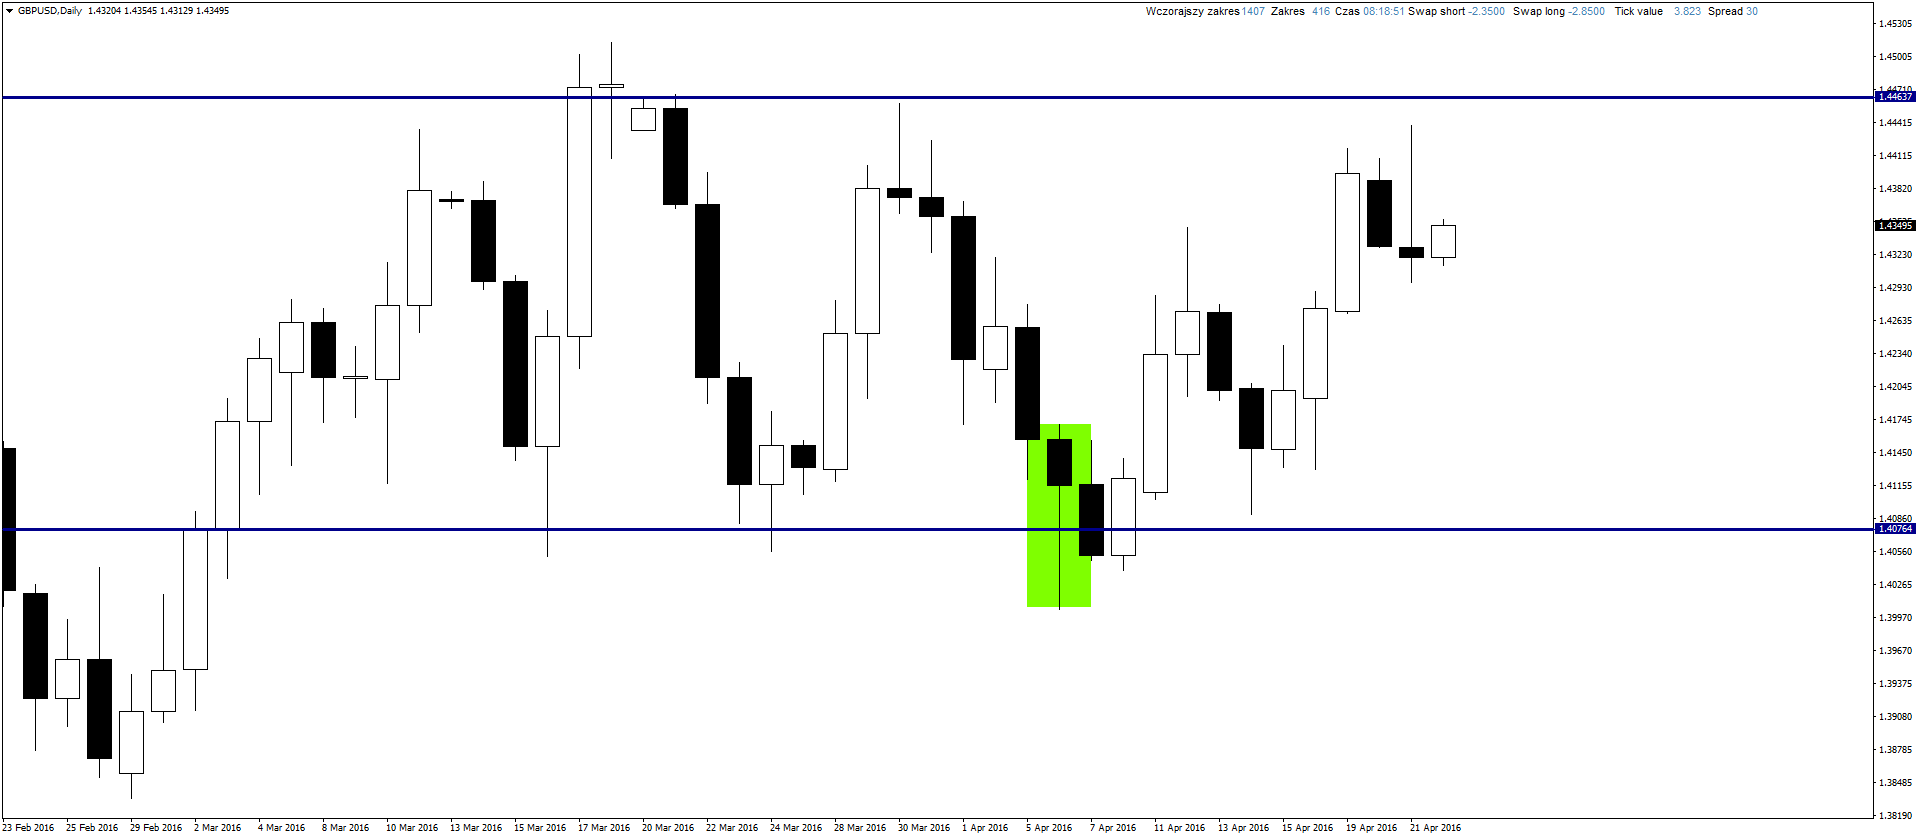
GBPUSD
It is time for mentioned in the beginning digression about position management. I wrote about possible buy signal few days before showing up and when it did, I opened position. We needed two weeks to reach Take Profit. Position wasn’t huge in case of RR, it was just about 3:1. However I want to write few words about keeping position for a longer time without looking at it during that.
I will shortly describe how I managed to learn that (I had huge problems with it). Before I started trading using Price Action I looked at dozens and dozens of strategies. I don’t say that it wasn’t useful because thanks to that I know a lot of popular systems, starting from regular indicators through classical technical analysis till advanced strategies using Elliott waves or Fibonacci projections. There was always one problem – management of opened position. Before it was opened I saw clearly where it should be closed. However after opening this image became blurry, emotions started to show up and I was closing positions to early. When I started trading using Price Action after analysis of my previous transactions I noticed that I didn’t used their full potential, I was closing them too early. I came up with a solution which you already know: closing half of position after reaching 2.5x Stop Loss and move SL to Break Even after that.
This year I changed basics of my system a little (entering position right after signal, without waiting for correction) and I noticed that I am able to play TP or SL. So if I have position with 50 pips of SL and 400 pips of TP I can wait for the solution (the only exception is some important data). This lets me get close to the position of true professionals – perfect system should bring profit with only 30% efficiency. Mine has bigger efficiency, but keeping good RR and taking advantage of potential of profitable positions is what this is about. I hope you understand what I mean in this quite long digression.
YOU CAN START USING PRICE ACTION AND INVEST ON FOREX MARKET USING FREE XM BROKER ACCOUNT.
And this is how position looked like:
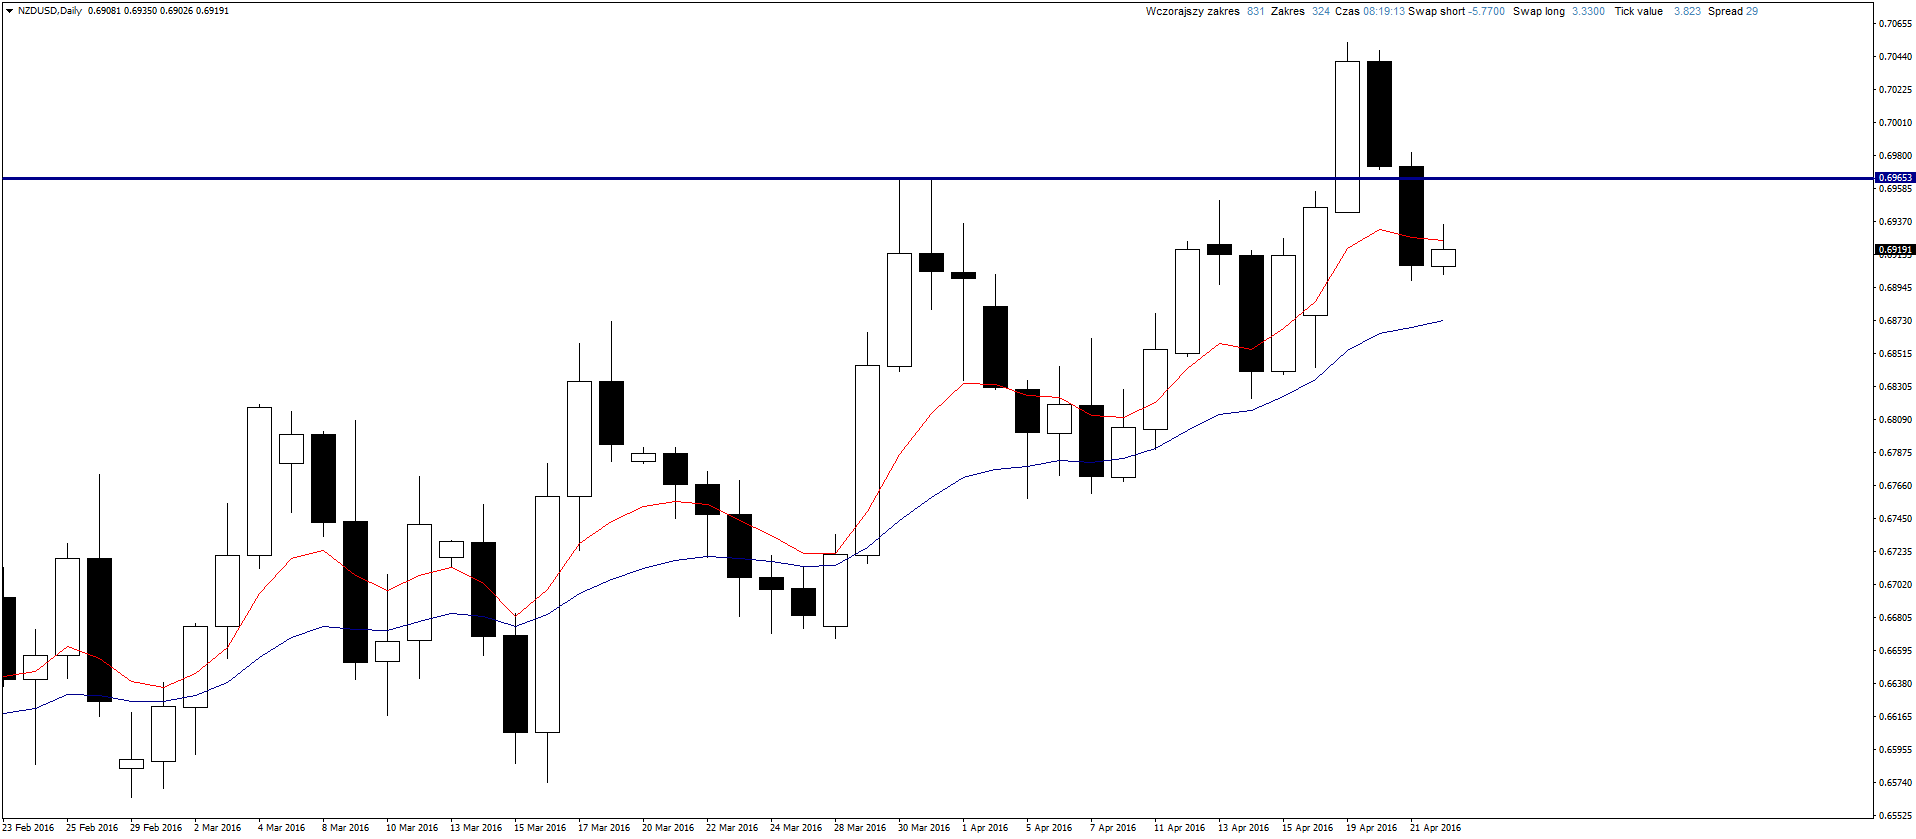
NZDUSD
I waited for buy signal after re-test of support from above but it was broken and we just have to wait for further improvement of situation.