I invite you to the Price Action Setups review after a fairly long break. The end of holidays is near so it’s time to go back to trading and I started last week! For sure it can not be said that it was a good start. Several false signals ended with Stop Loss, but all the time loss should be made up with excess with one Take Profit. Here we go:
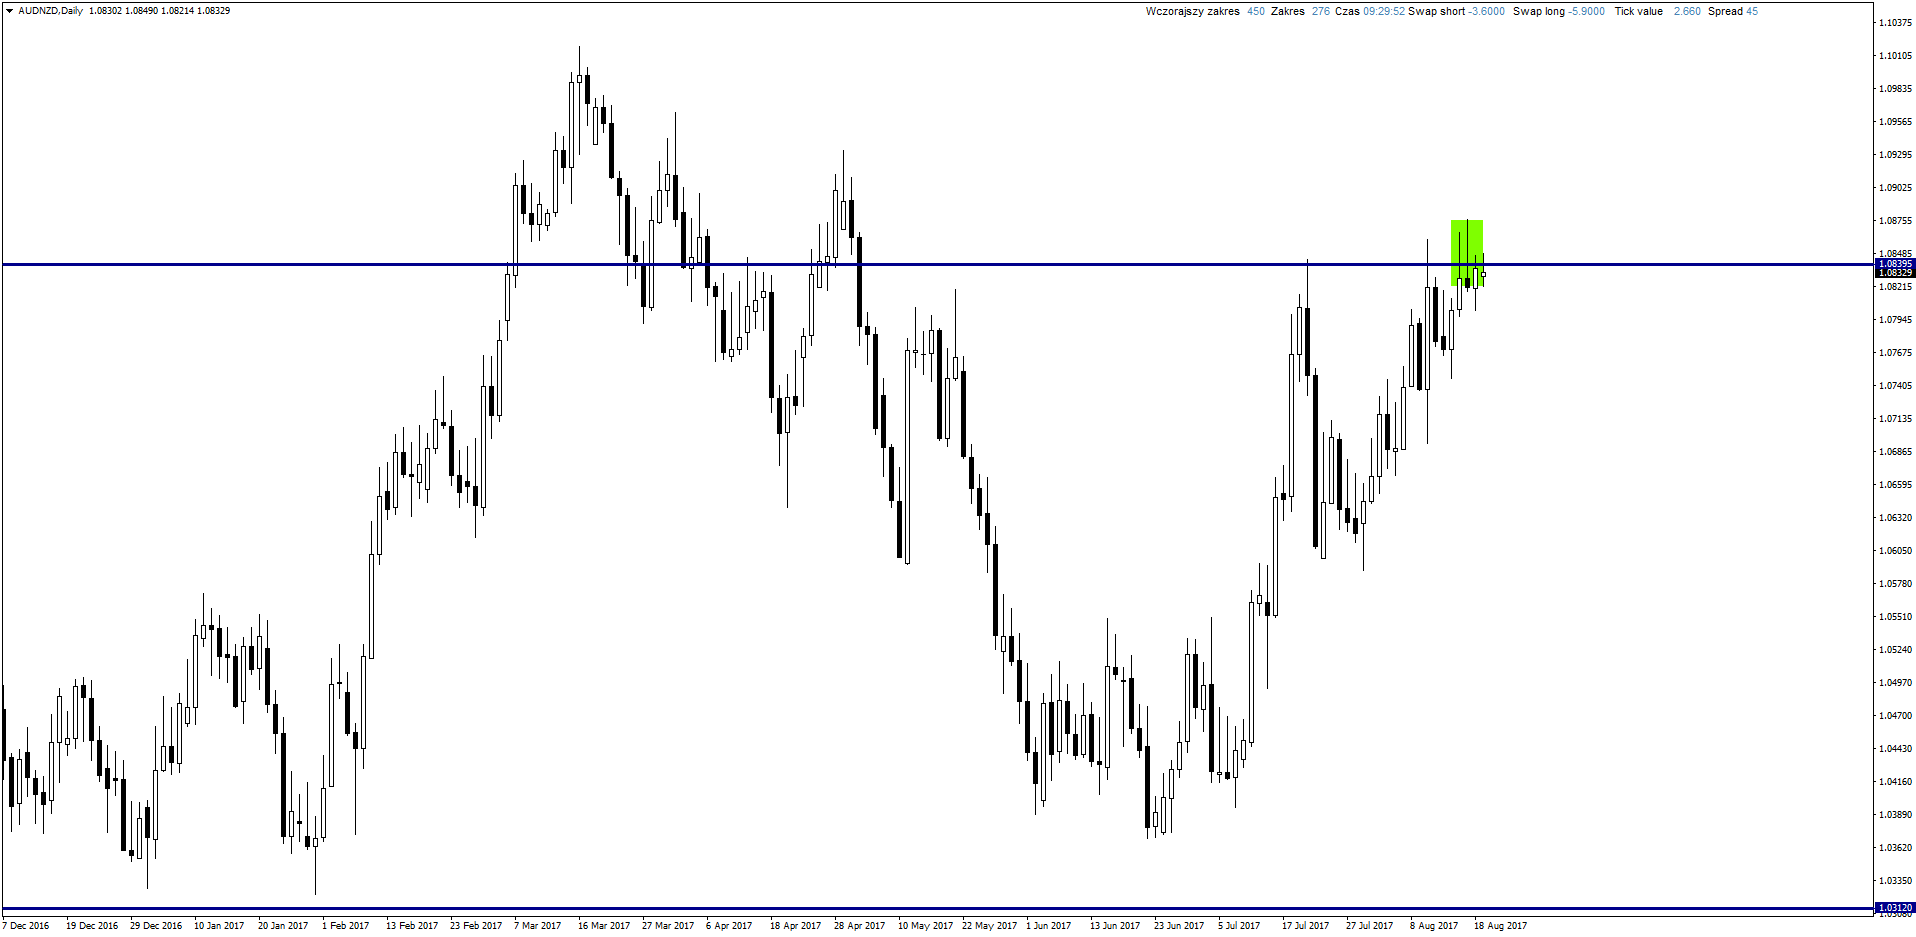
AUD/NZD:
Sell signal on Australian Dollar to New Zealand Dollar appeared on Thursday. Long pin bar candle on the resistance. However, the graph is too chaotic to open a position, so I would rather pause.
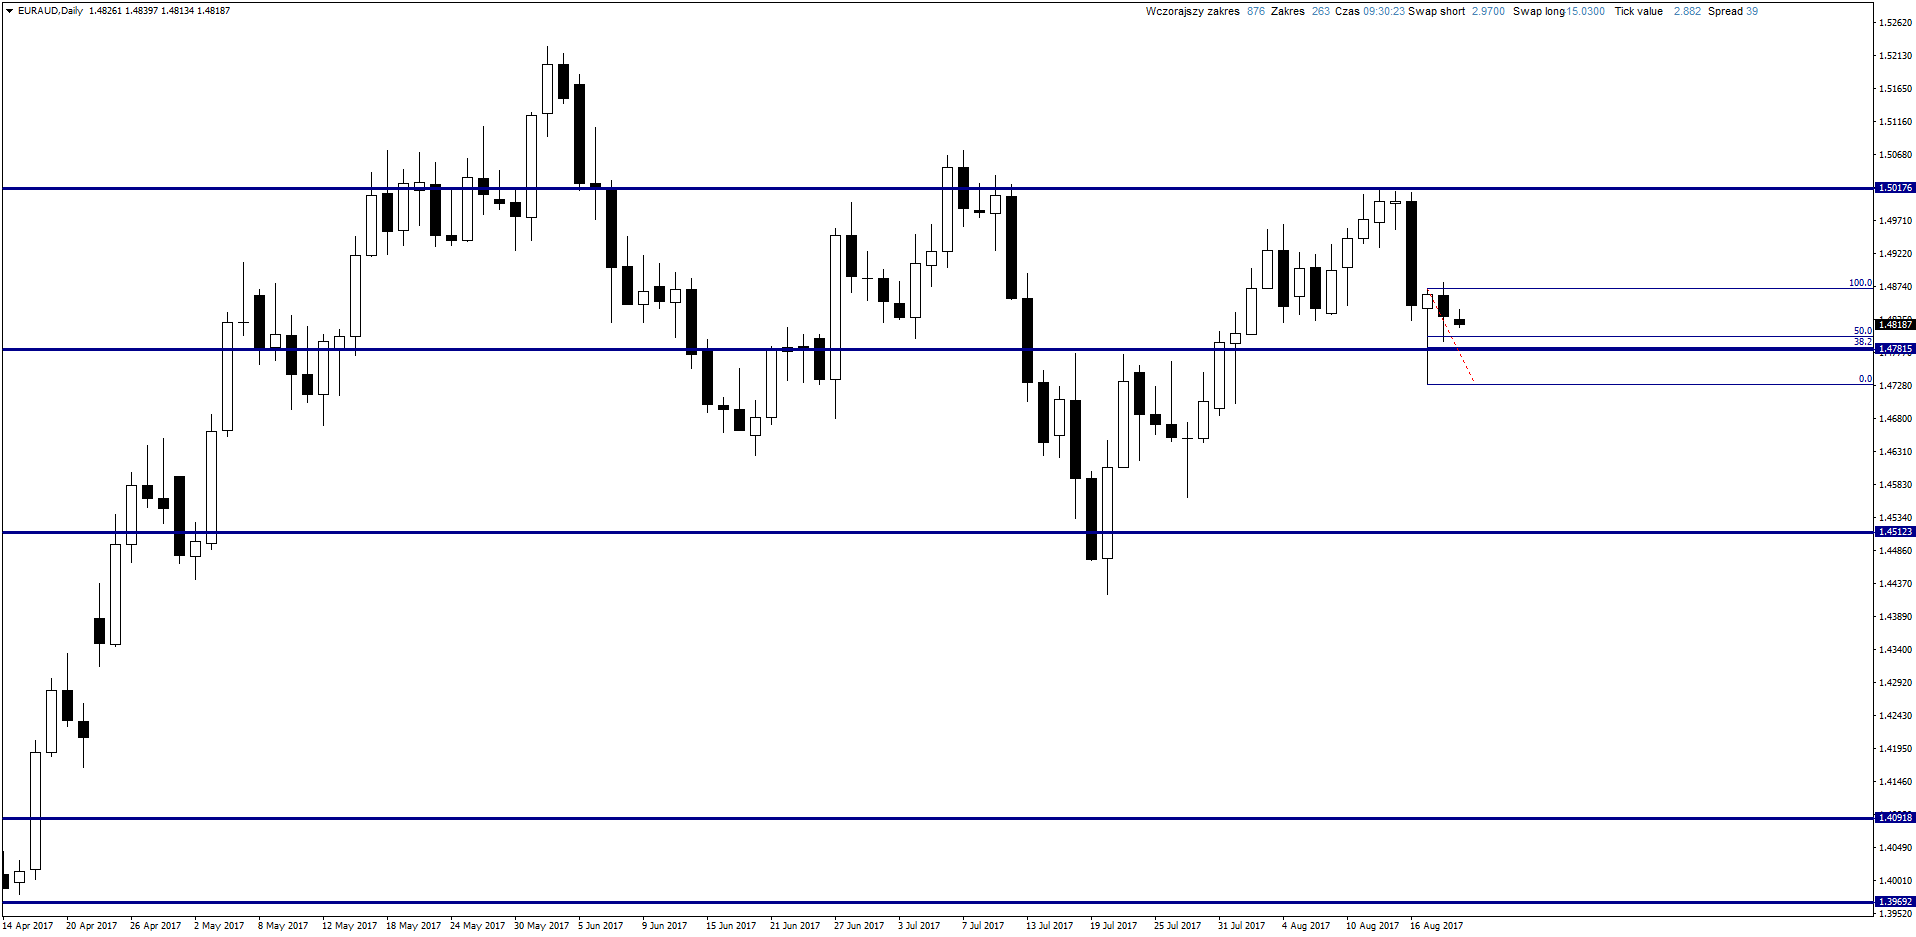
EUR/AUD:
About the signal I wrote on Friday LINK and actually the price reached 50% of the big candle bar bar which activated Buy Limit order. Now it is time to wait for further price behavior.
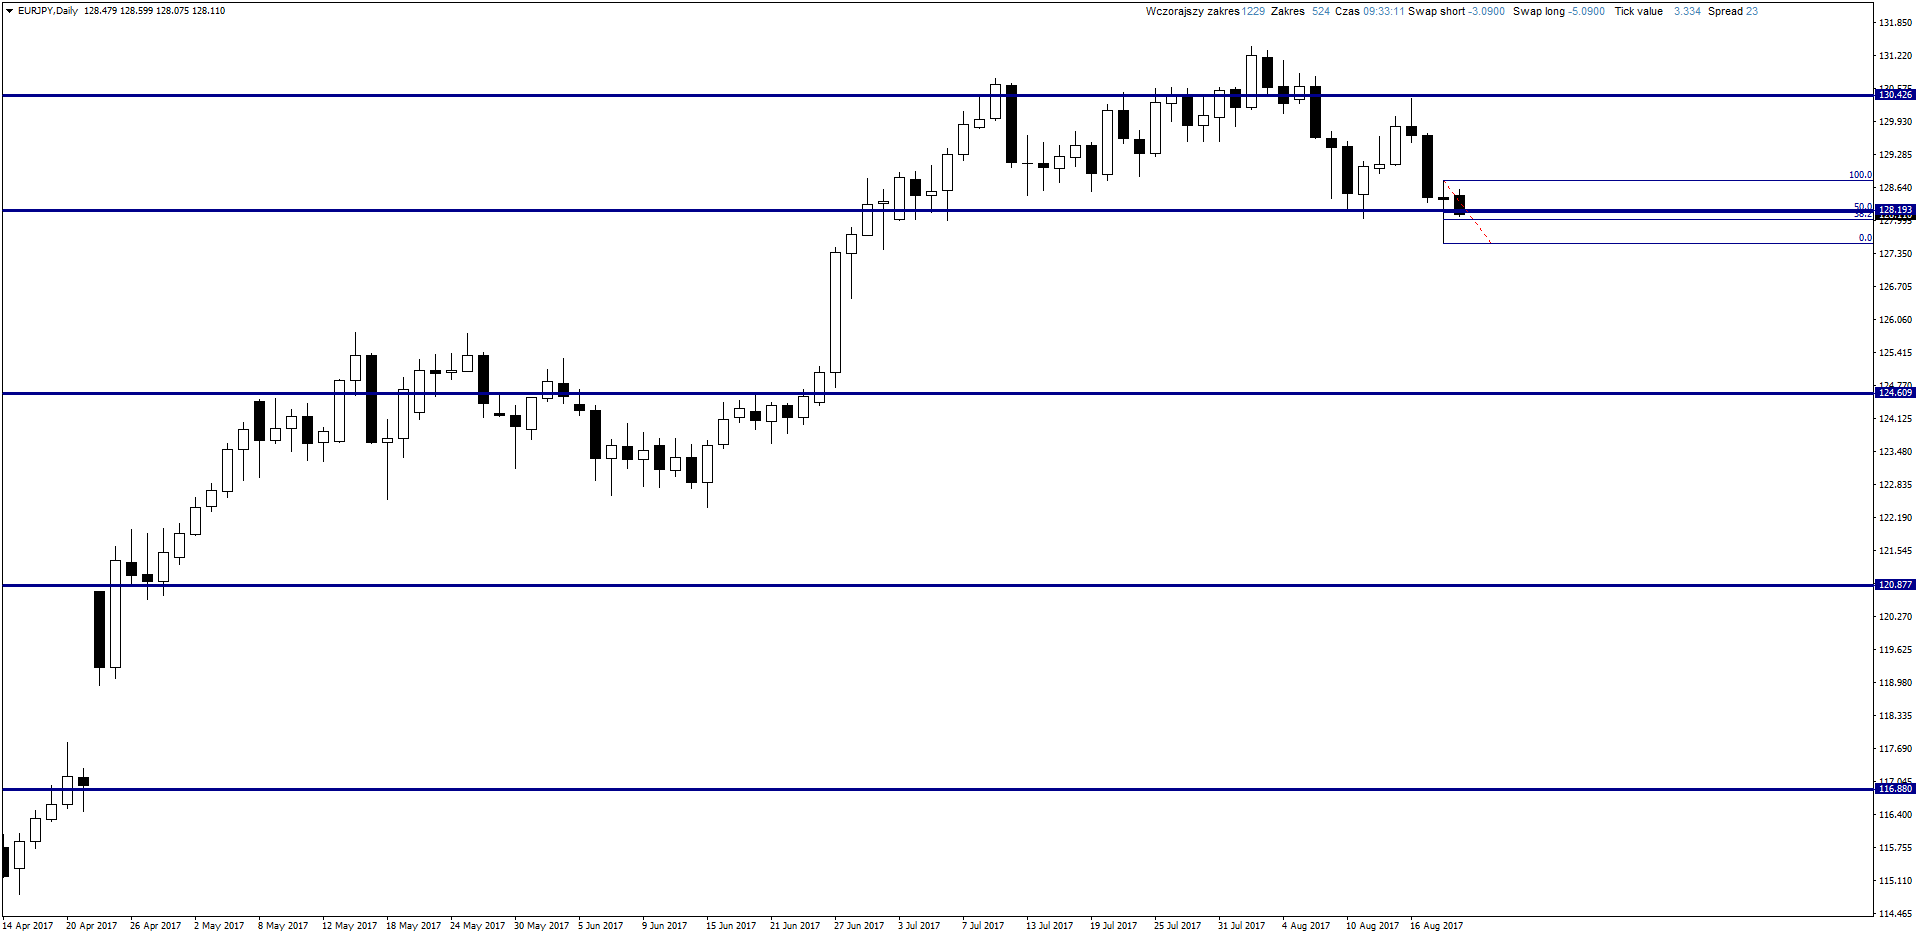
EUR/JPY:
Another buy signal for the pair. On Friday there was a breakdown, but very soon it was negated which created a candle pin bar. It is worth considering setting the buy limit order at 50% of its abolition, which would give a Stop Loss of about 55 pips, and Take Profit near the resistance that is more than 200 pips higher. You also need to pay attention to the formation of Head & Shoulders, which is formed on the graph, and Friday’s breakout should have activated it. It did not happen, the price went back and it could be a negation of the formation which gives a strong increase signal.
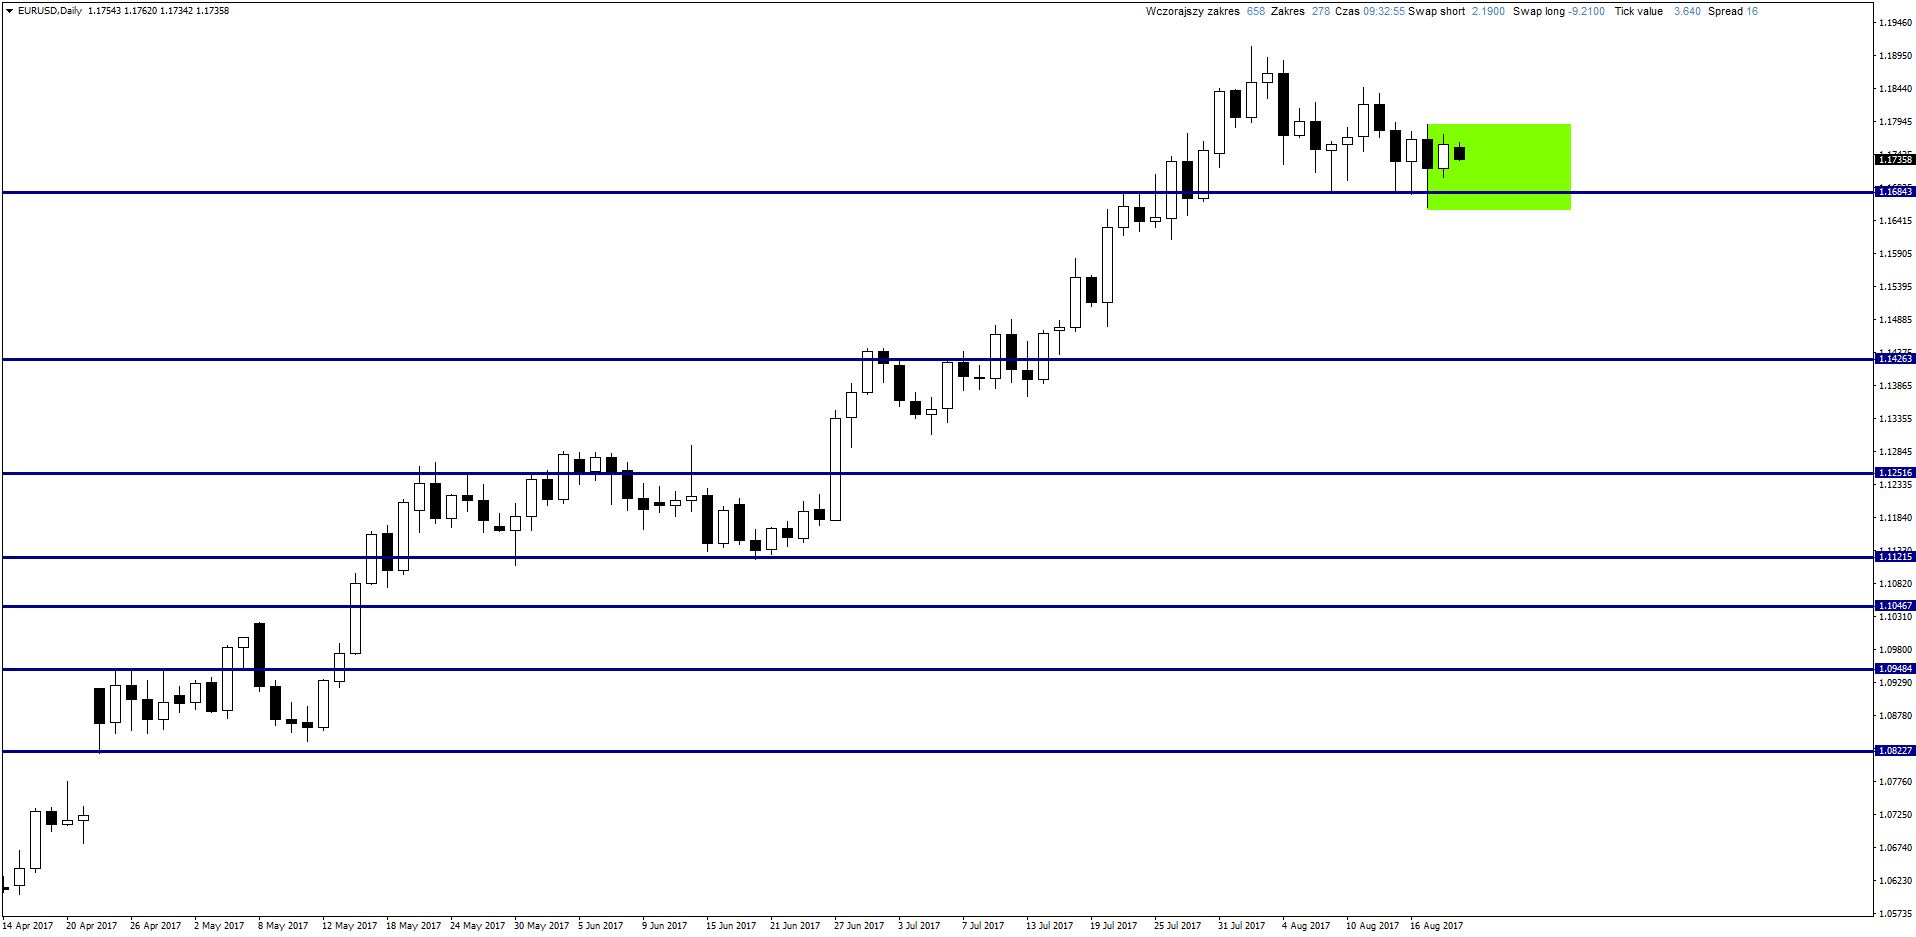
EUR/USD:
On the Eurodollar chart, there is a Inside Bar setup forming, which allows you to trade both long and short positions:
If it hits the bottom and the candle closes below the candle’s range, it will be short
If it hits the bottom, but the price goes back and closes within body of the candle it will be a signal for going long,
If it hits the top and the candle closes above the mother’s candle range, it will also be a long signal.
Of course, you must remember to select the appropriate parameters SL and TP
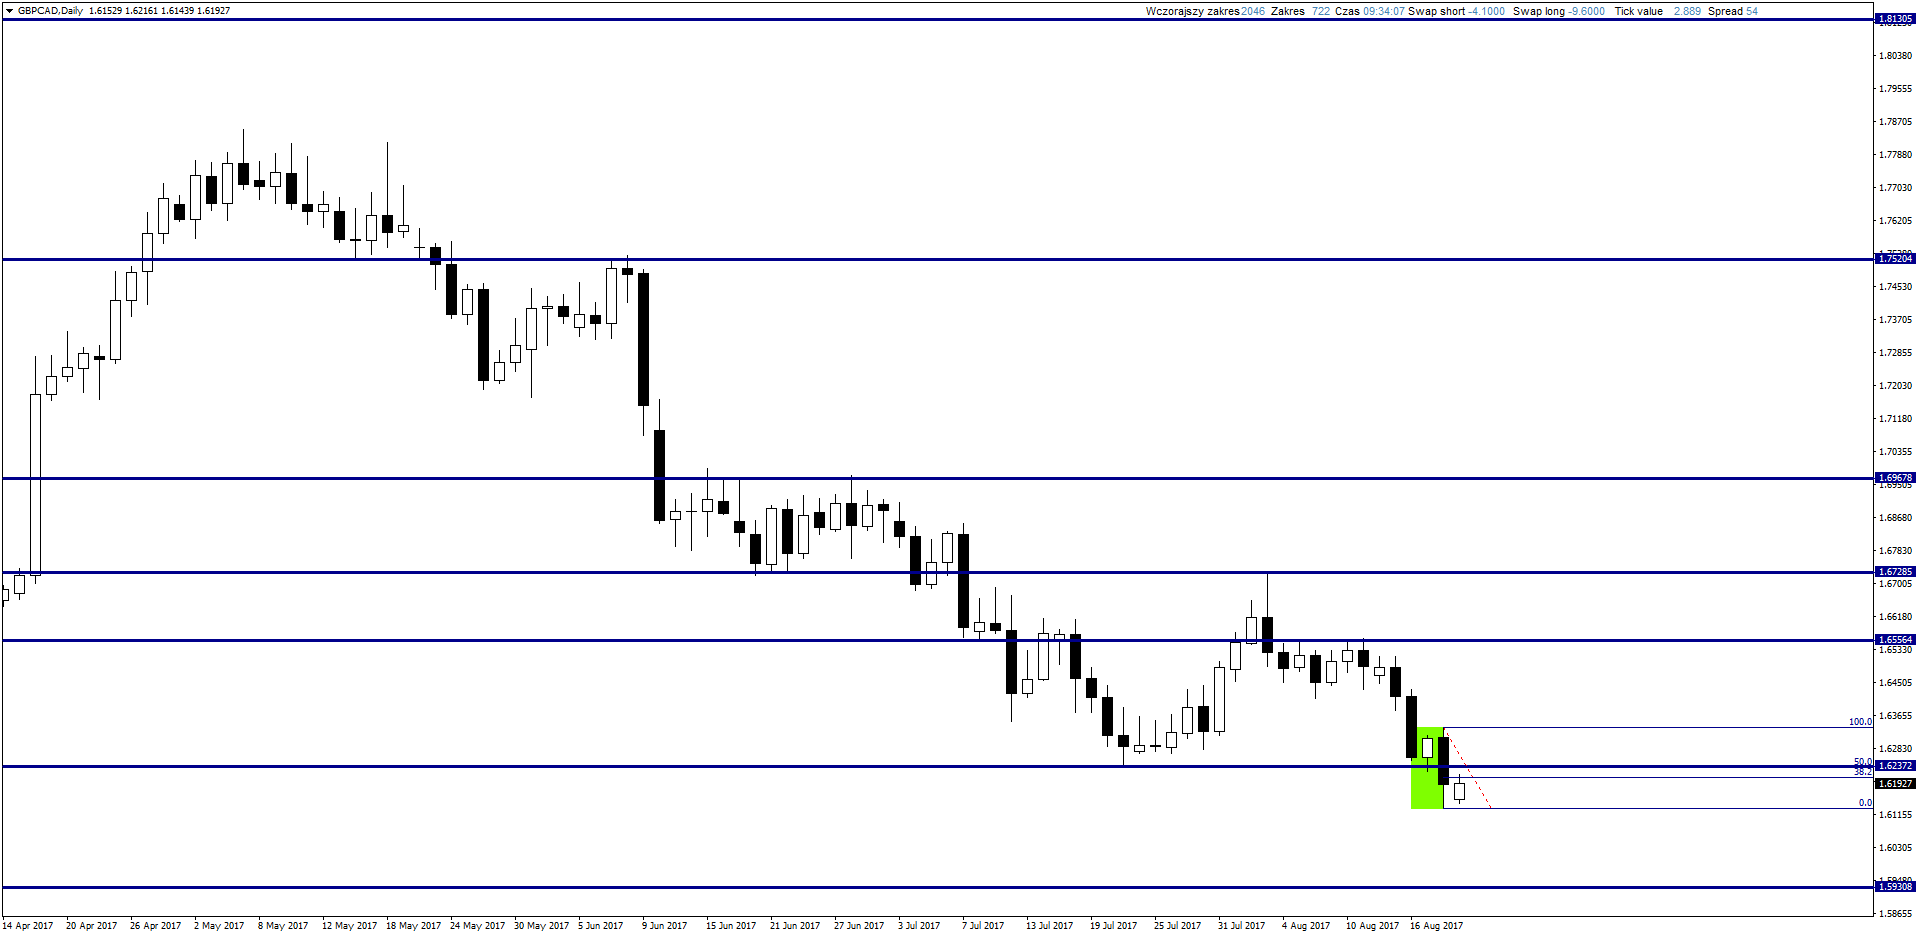
GBP/CAD:
Interesting signal on the pair- an Outside Bar. Friday candle completely covered Thursday’s giving a sell signal. Now it is worth waiting for a correction to 50% of its abolition and there open only shorts, because it will give you a much better risk/reward ratio about 4:1.
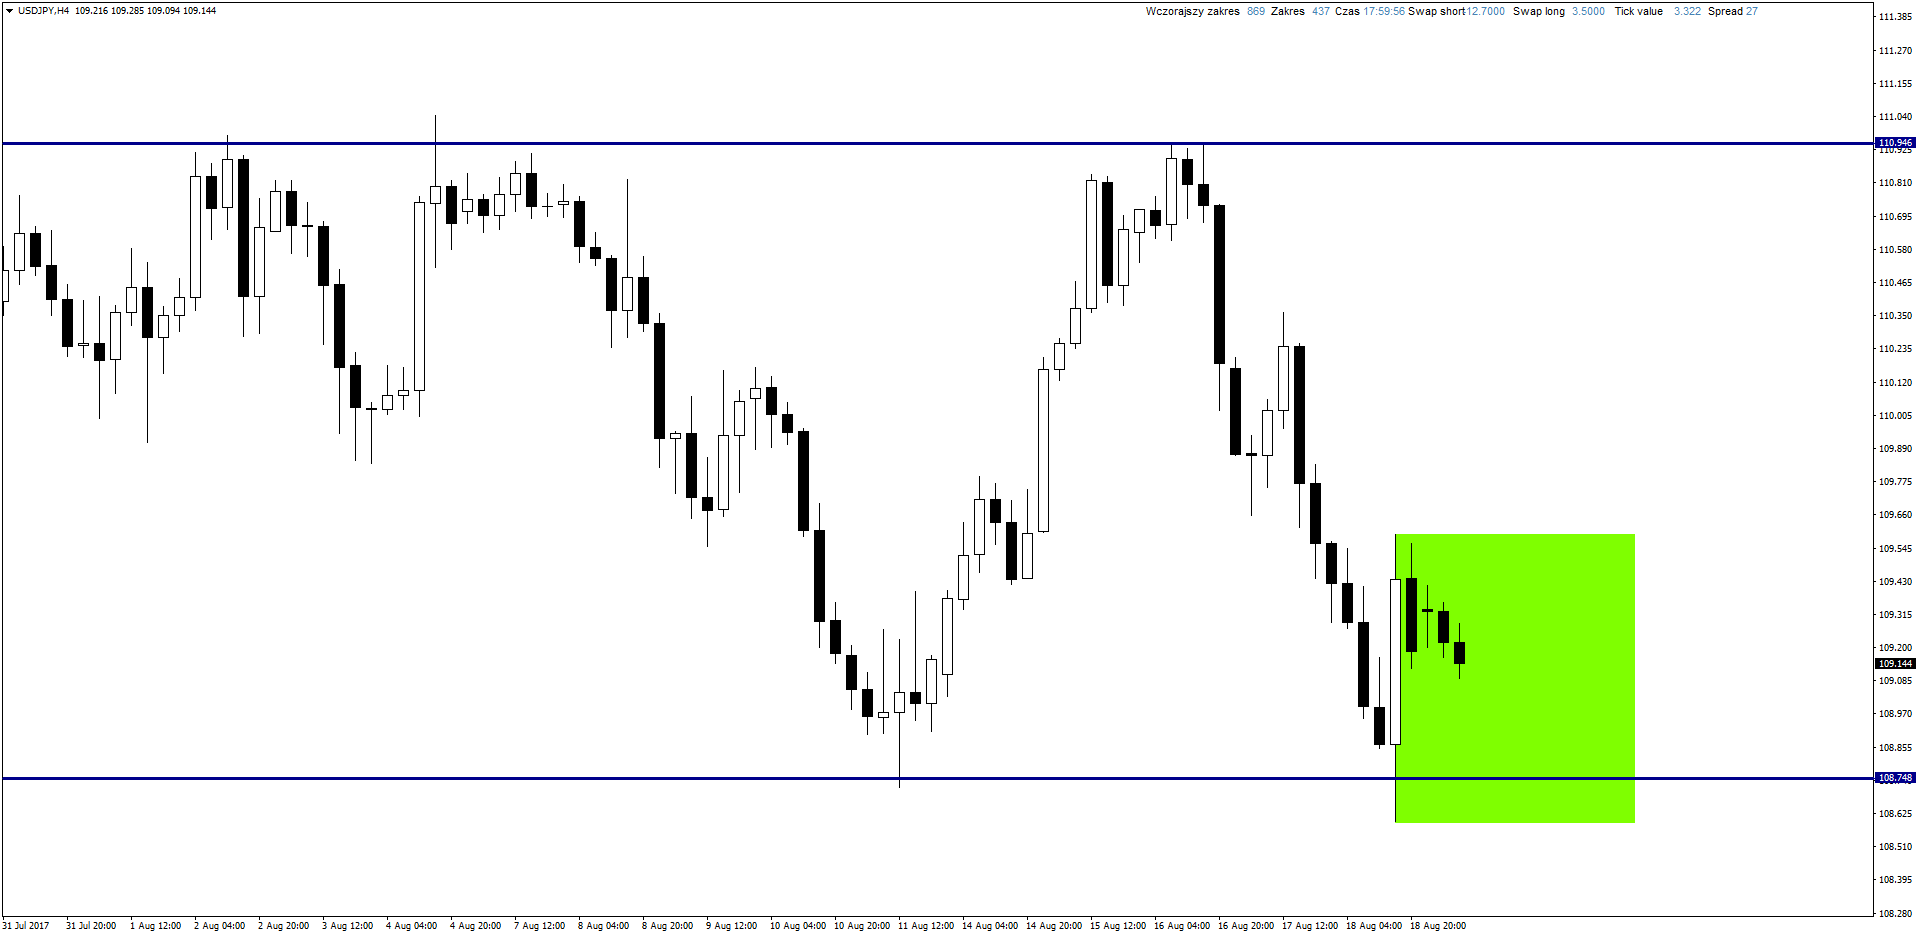
USD/JPY:
The pair is trapped between fairly close levels of support and resistance. On the H4 chart you can see Inside Bar setup, fourth candle is completely covered by the mother candle. It will be worth looking for signals to open positions analogous to Eurodollar:
If it hits the bottom and the candle closes below the candle’s range, it will be short
If it hits the bottom, but the price goes back and closes within the mother candle it will be signal for going long,
If it hits the top and the candle closes above the mother’s candle, it will also be a long signal.


 Review")


