“Search, Analyse, Trade” is a series of Price Action and Elliott Waves analyses. Its detailed step-by-step description can be found over here. I invite you to today’s review of selected currency pairs and potential trading opportunities. The analyses are based on the Dukascopy sentiment that you can get here.
 EUR/USD remains in the third wave. I counted on a larger correction in the fourth wave, but it is most clearly not the moment. The fake breakout from Inside Bar is still continuing and the pair has reached the resistance zone and its upper limit. If the pair succeeds in defeating the zone, there will be approximately 150-200 pips free zone for growth.
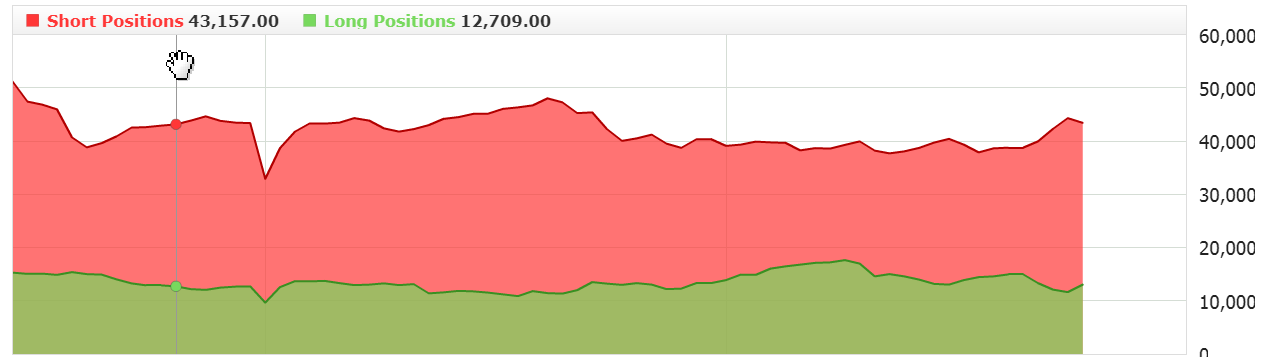 The sentiment is slowly changing and is set towards rejecting the resistance zone. Yesterday, however, it was neutral, so you could open the position on this pair.
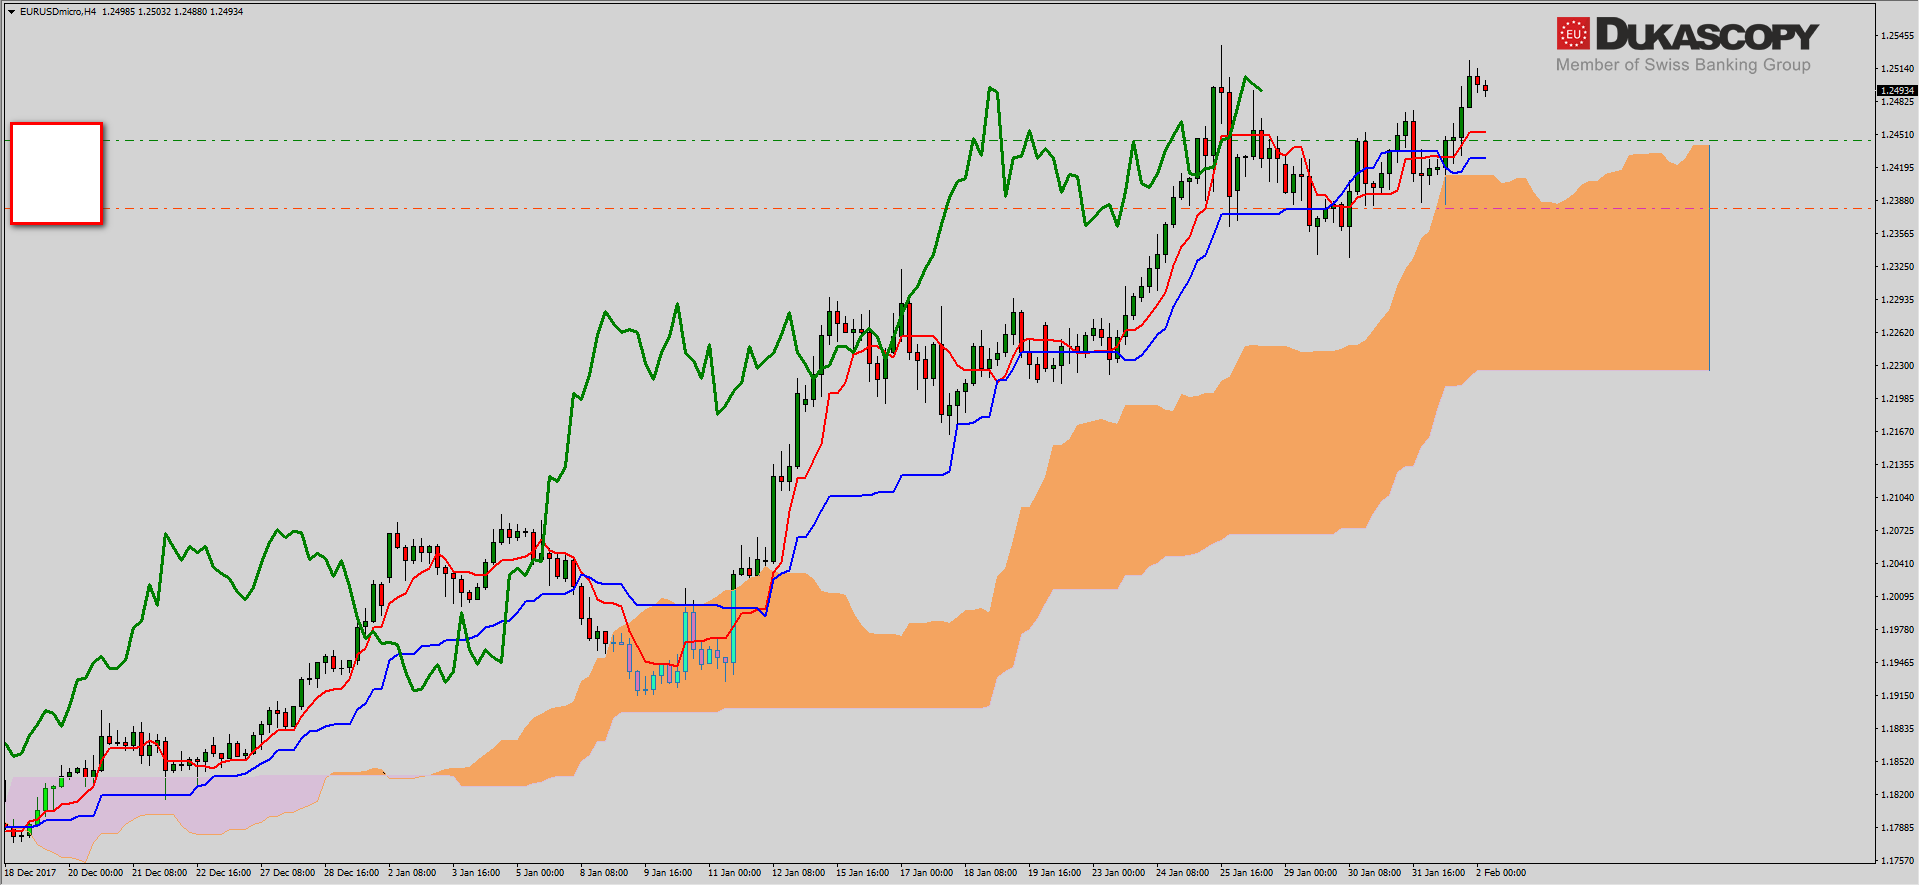 There were two signals. The pair arrived at the Senkuo Span A line and rebounded from it. A demand candle emerged, which went above the lines of Tenkan and Kijun. At the same time, a golden cross was created over the cloud. Due to the proximity of the resistance, the movement is not dynamic and now a growth triangle is being created. Either it turns into the third wave, or we will see another move towards the cloud.
The partner of “Search, Analyse, Trade” series is a Dukascopy Europe broker who gives its customers access to ECN accounts in different currencies.
Trade on Forex, indices and commodities thanks to Swiss FX & CFD Marketplace. Open free trading account right now.
A similar situation is on GBP/USD. Still, the pair remains in a growth movement, which was based on a fake break-out from the Inside Bar
after the support was rejected. The price has just reached the resistance zone and we are waiting for the reaction.
The sentiment remains neutral despite dynamic growth. We do not have major changes in the number of positions.
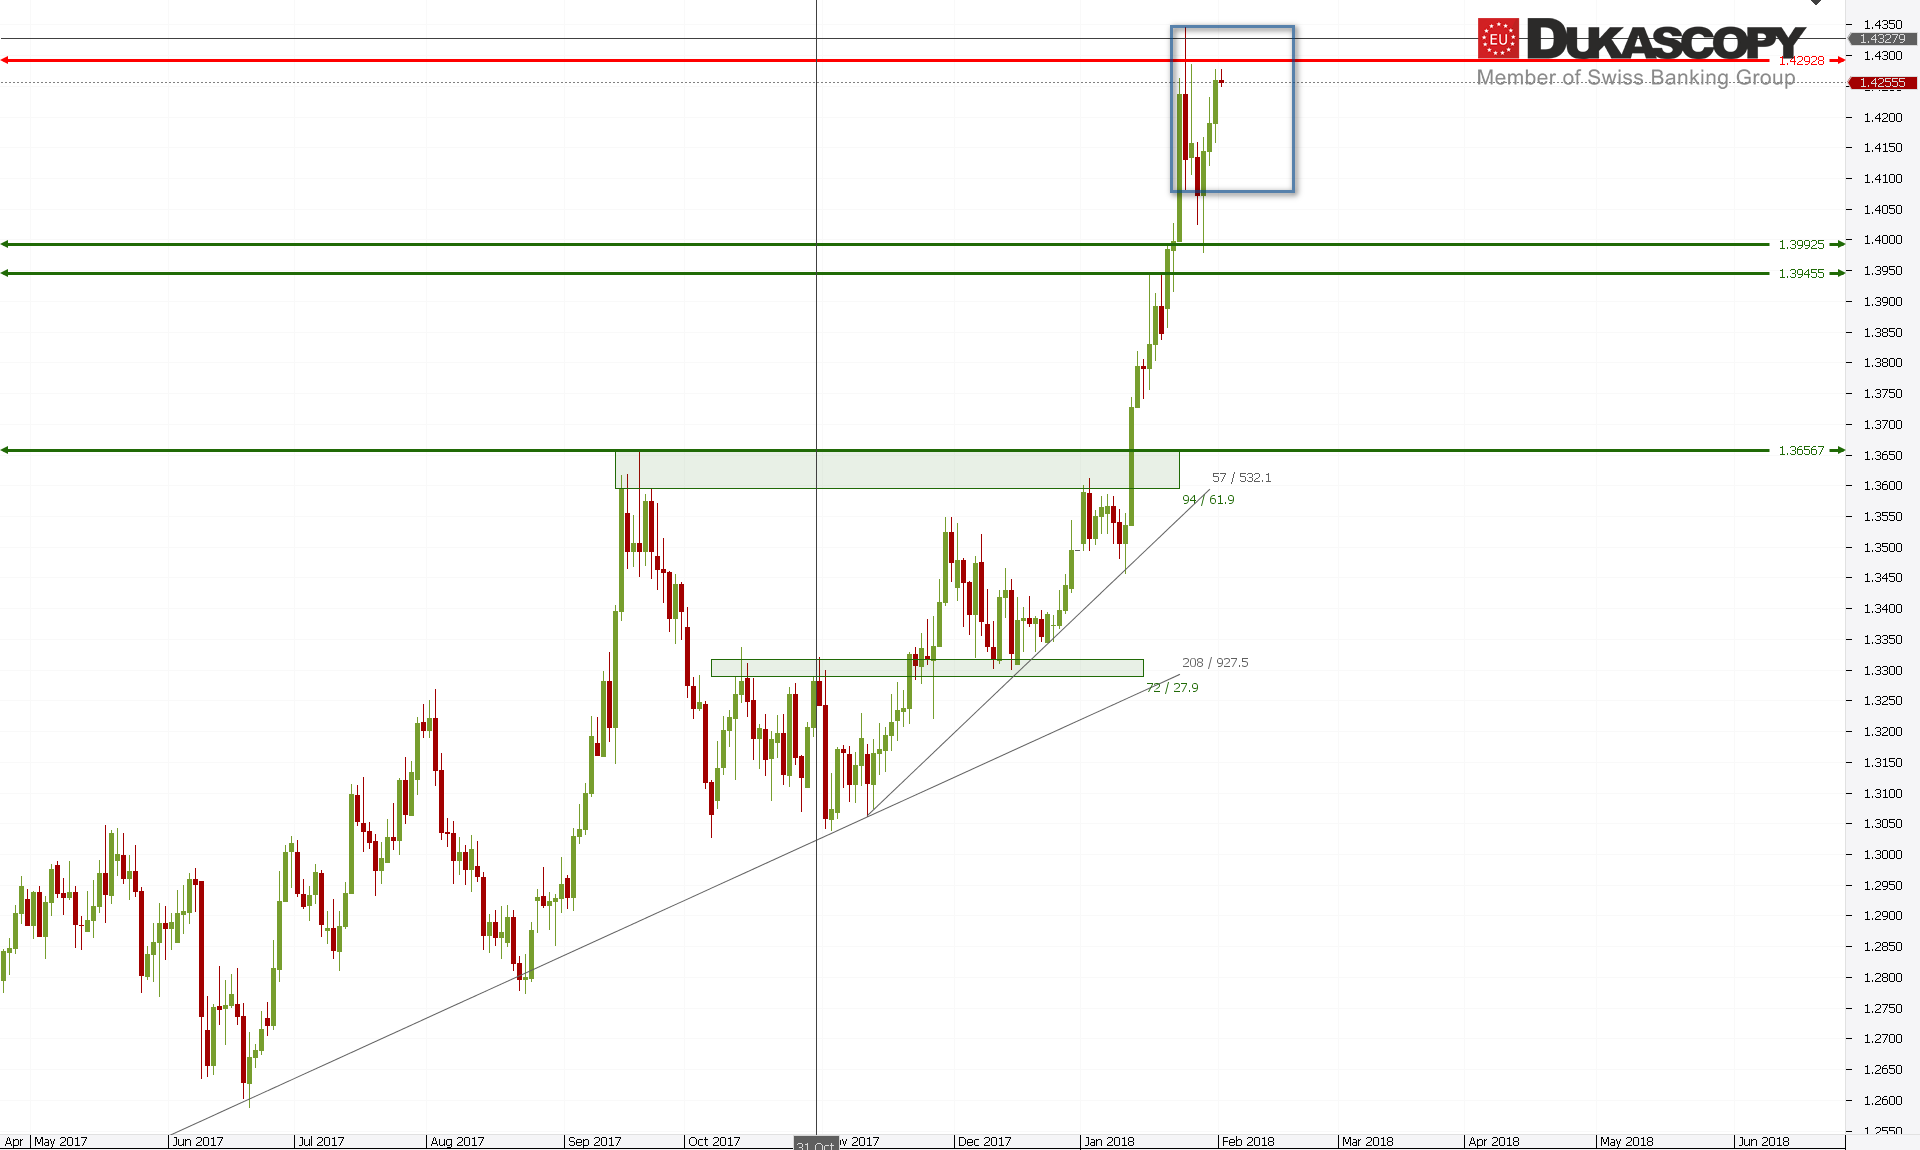
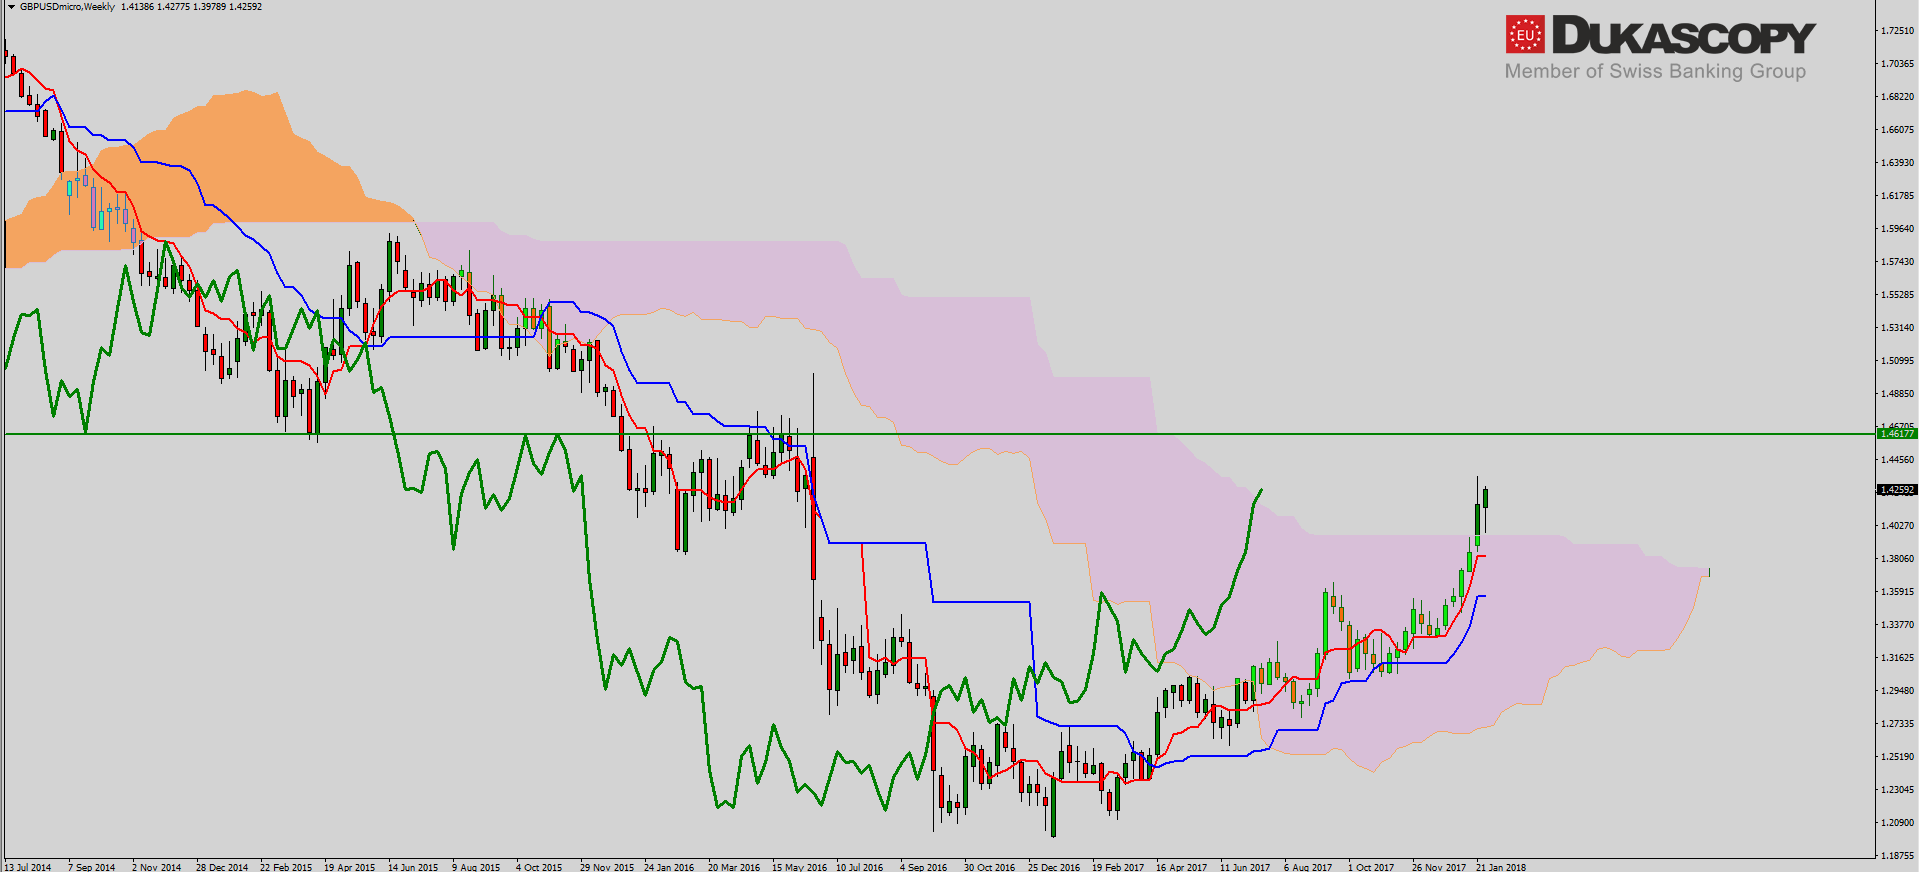 A glance at the weekly chart – here we see the ideal re-test of the flat line of Senkou Span B and breaking of the Chikou line over the cloud. If the pair deals with the current resistance zone, a 400 pips space for further increases will open.
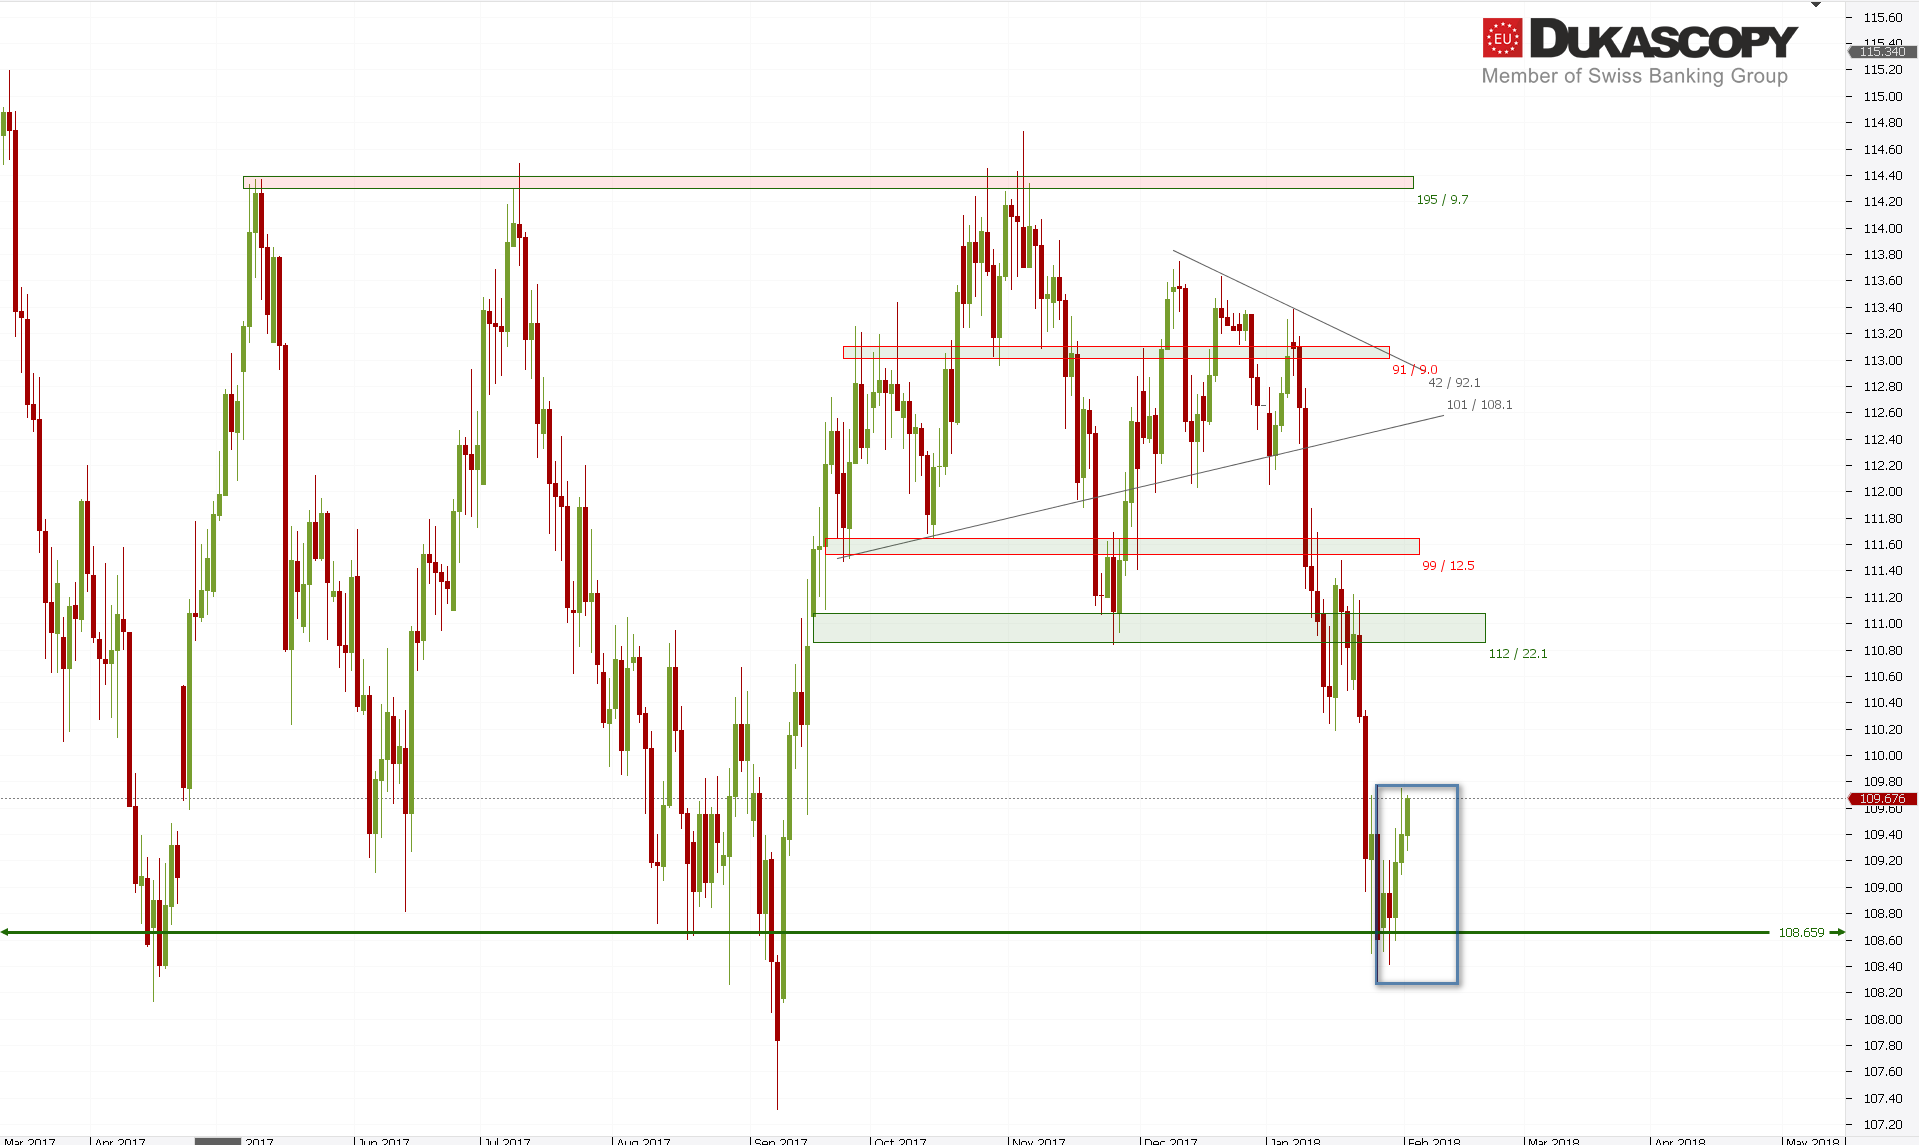 USD/JPY continues to rebound from the support towards the upper limit of Inside Bar. Breaking it thru the top should lead to greater rebound. Such a move may reach the abolition of 38.2 last bearish wave. In the longer term, however, we should see a continuation of decreases or a greater lateral movement.
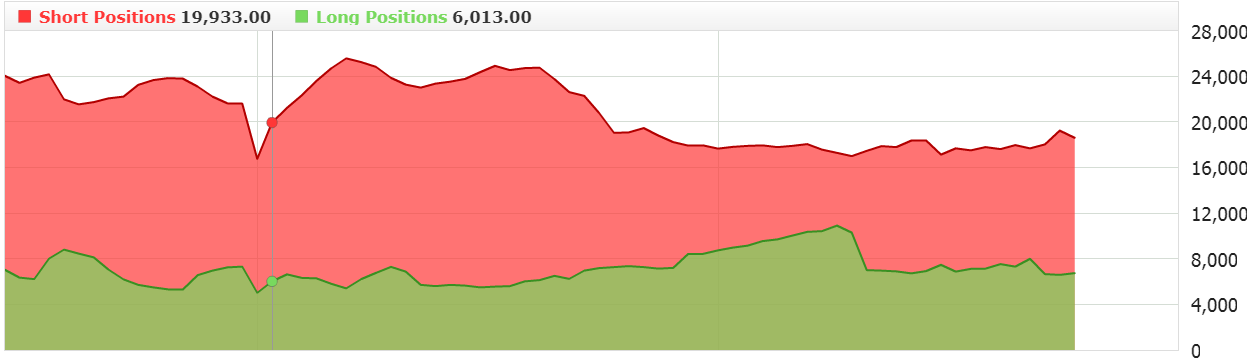
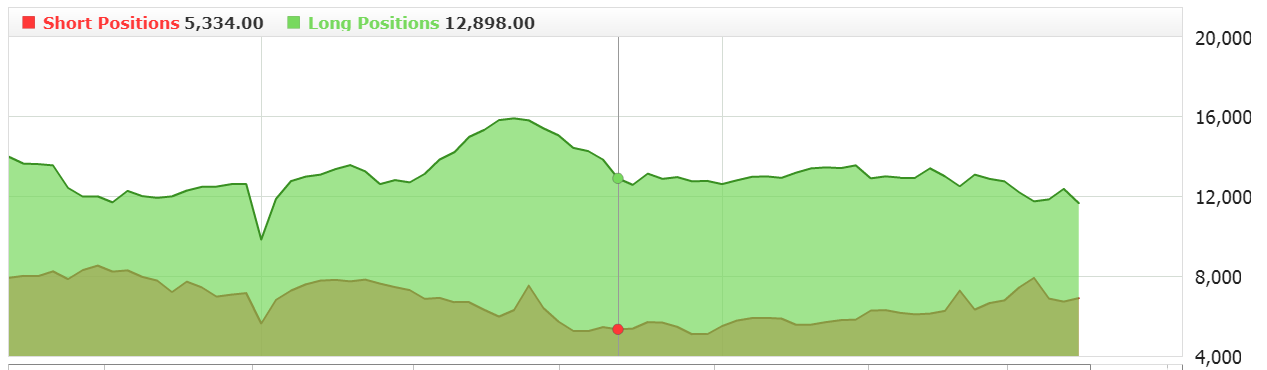 The sentiment continues to change the attitude and for a long time we have been watching increase in short positions and reduction of long ones. So you can look for opportunities to go short.
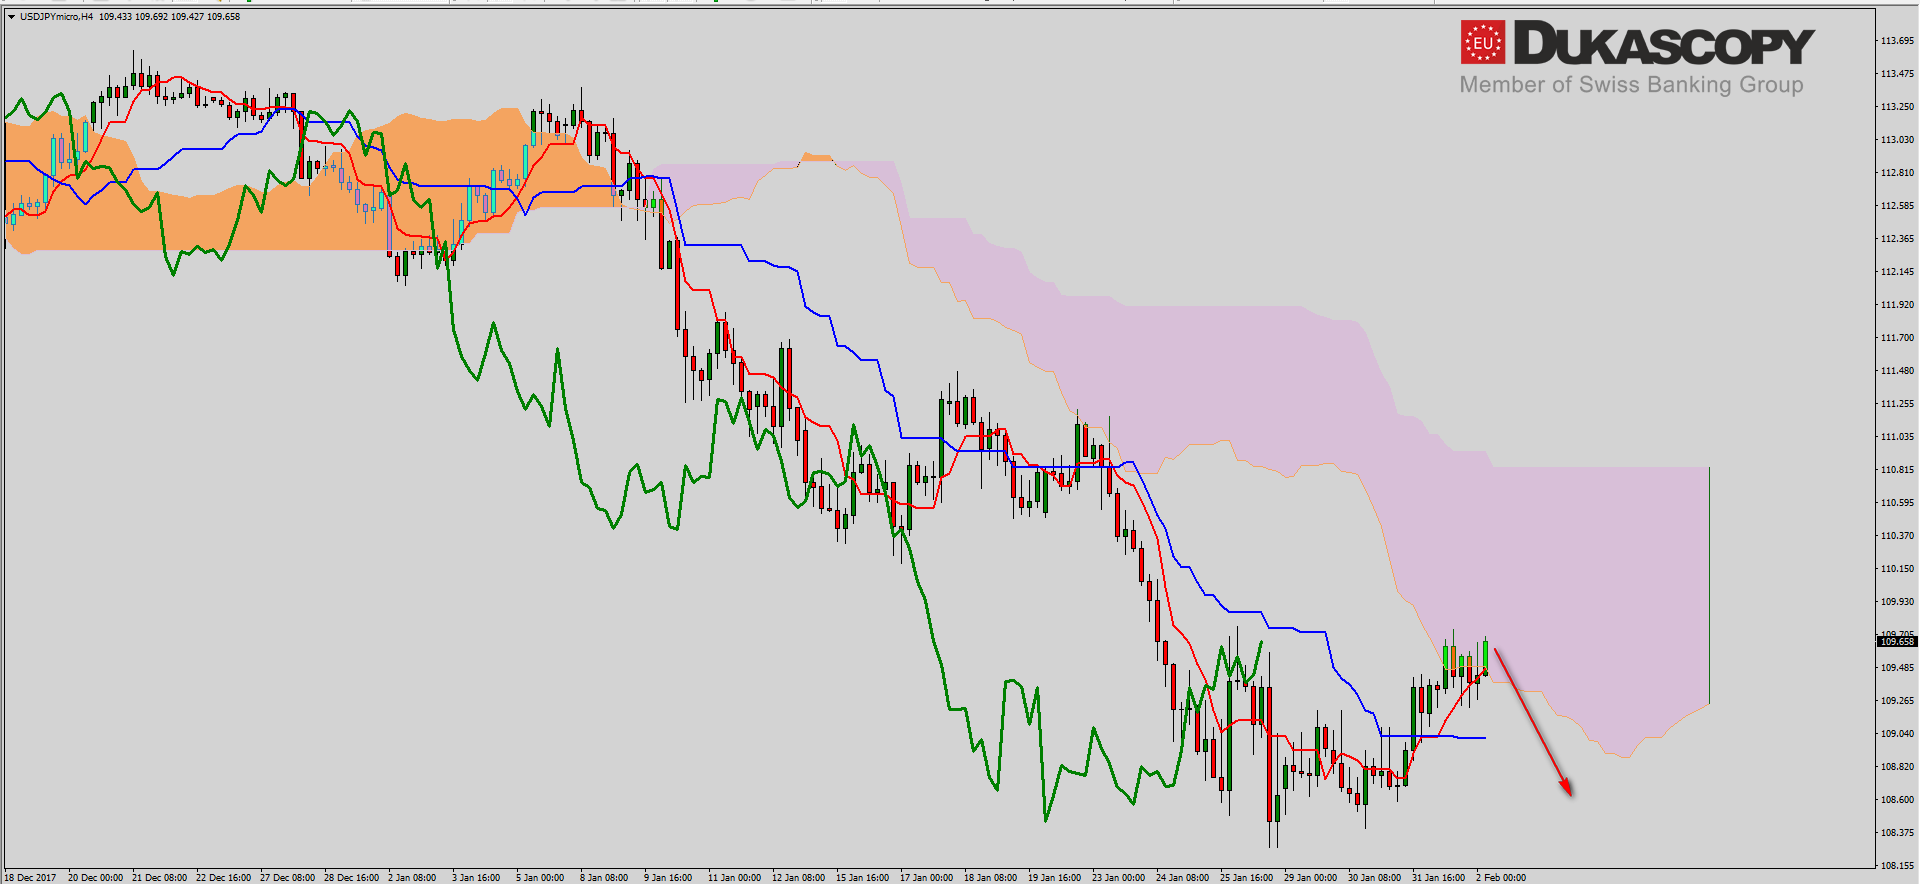 On the H4 chart, we can see that the pair, after defeating the Kijun line, continued planned increases towards the Senkou Span A line. Currently, the pair is in the cloud. Exiting it thru bottom will be a signal to continue the declines.


 Review")


