 “Search, Analyse, Trade” is a series of Price Action and Elliott Waves analyses. Its detailed step-by-step description can be found over here. I invite you to today’s review of selected currency pairs and potential trading opportunities. The analyses are based on the Dukascopy sentiment that you can get here.
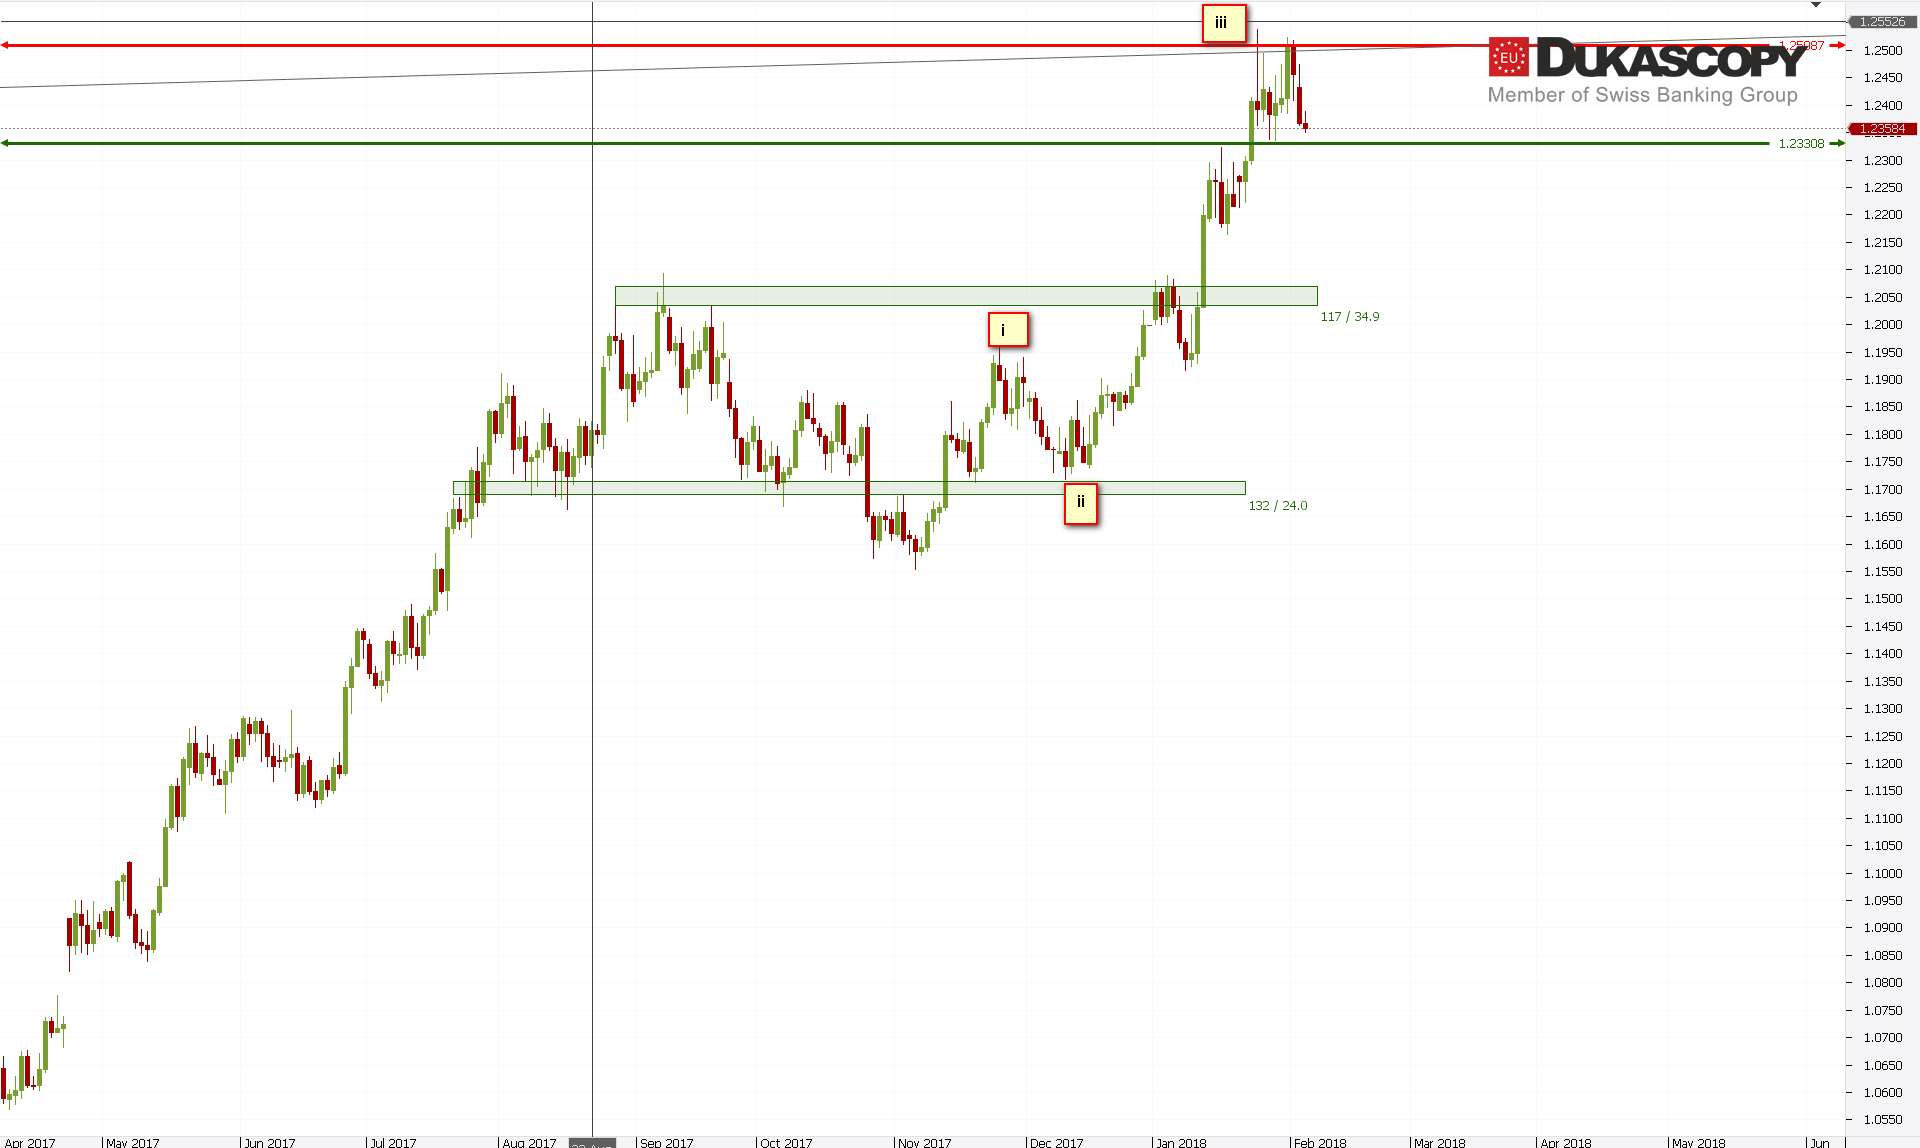
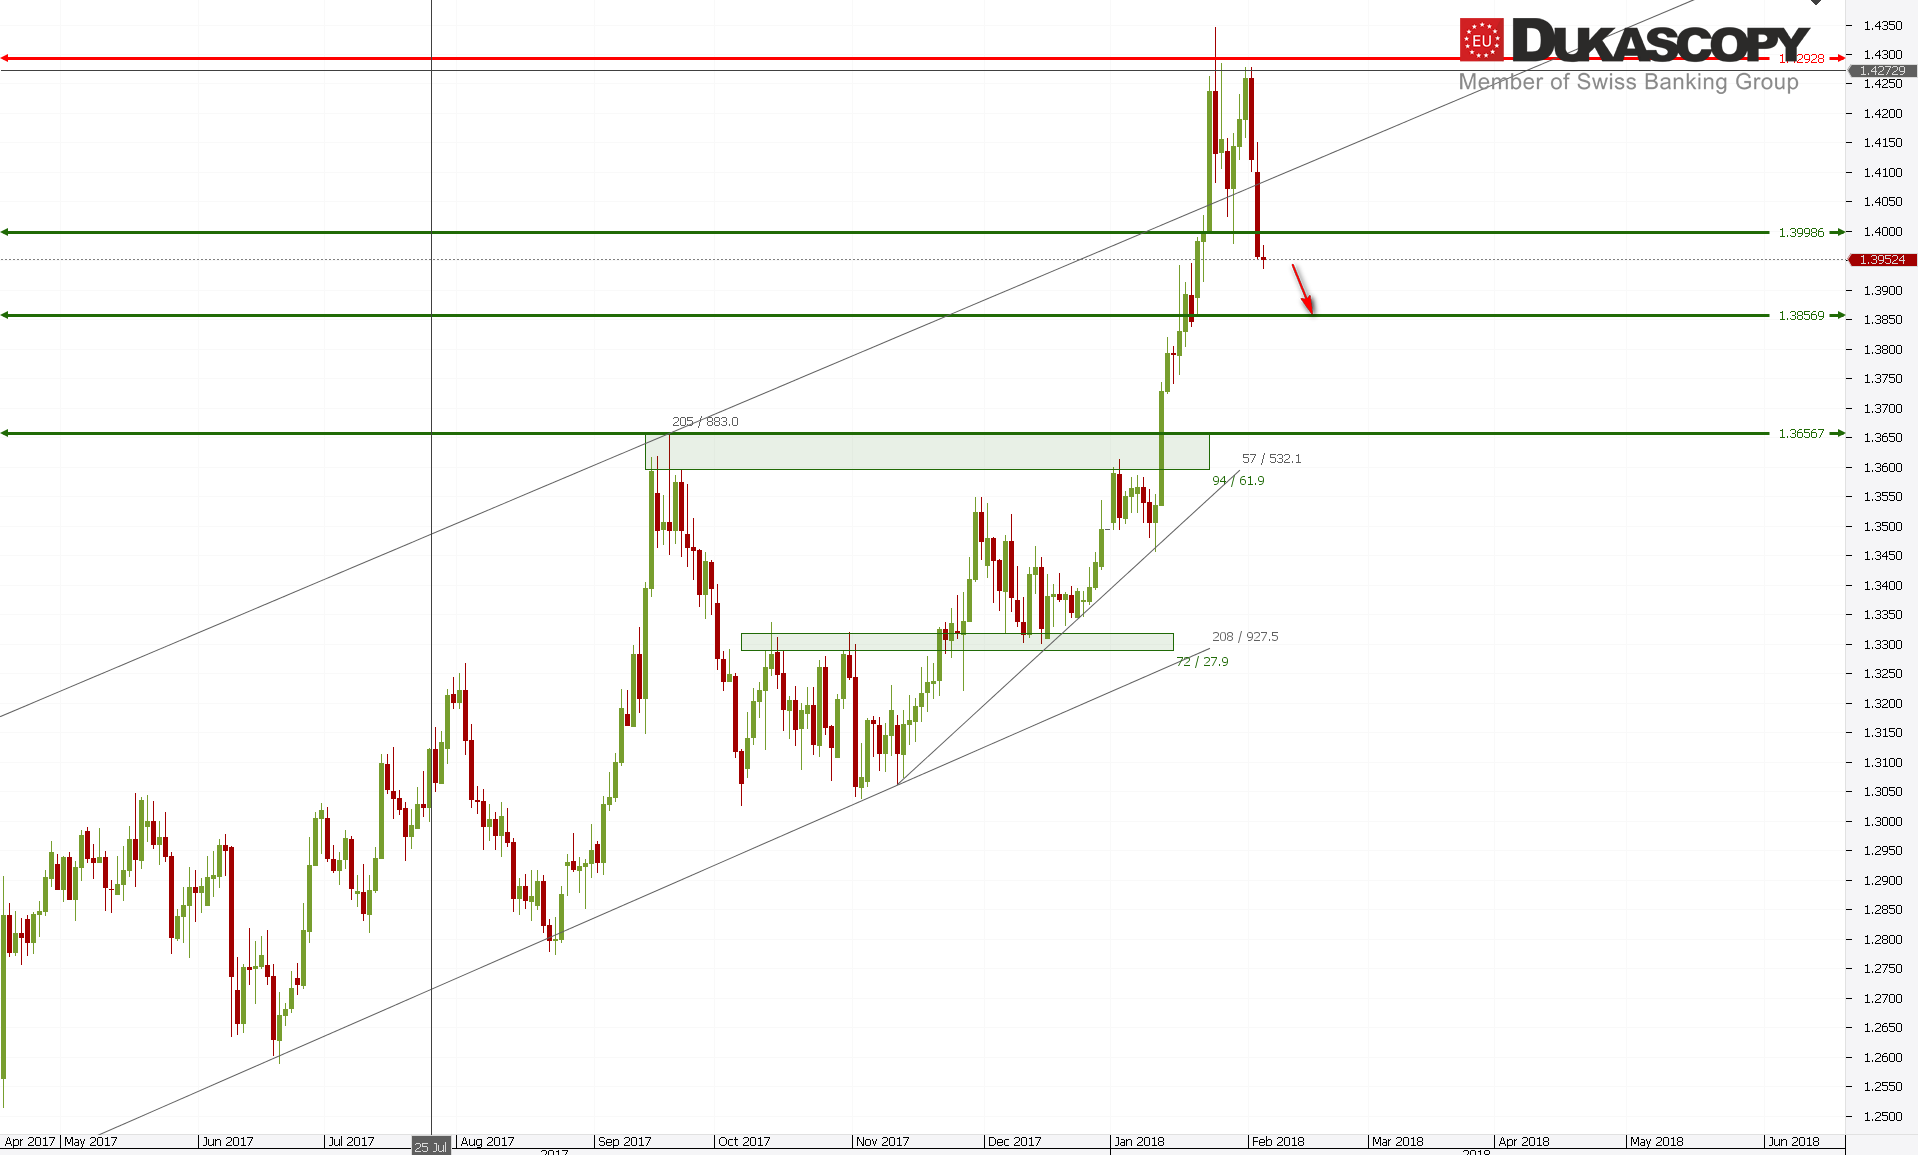
EUR/USD didn’t manage to overcome the key resistance for the second time in recent days. The pair has rejected the level and is currently moving towards support zone. From the wave point of view, the last upward sequence should be ended with the third wave, and the current decline with continuation of the fourth wave. Currently, we are creating a simple correction, which can turn into eg. a formation of a triangle. A lot will depend on the test of the nearest demand zone.
 Last drops are used to open long positions. This means that you will be able to look for a long position.
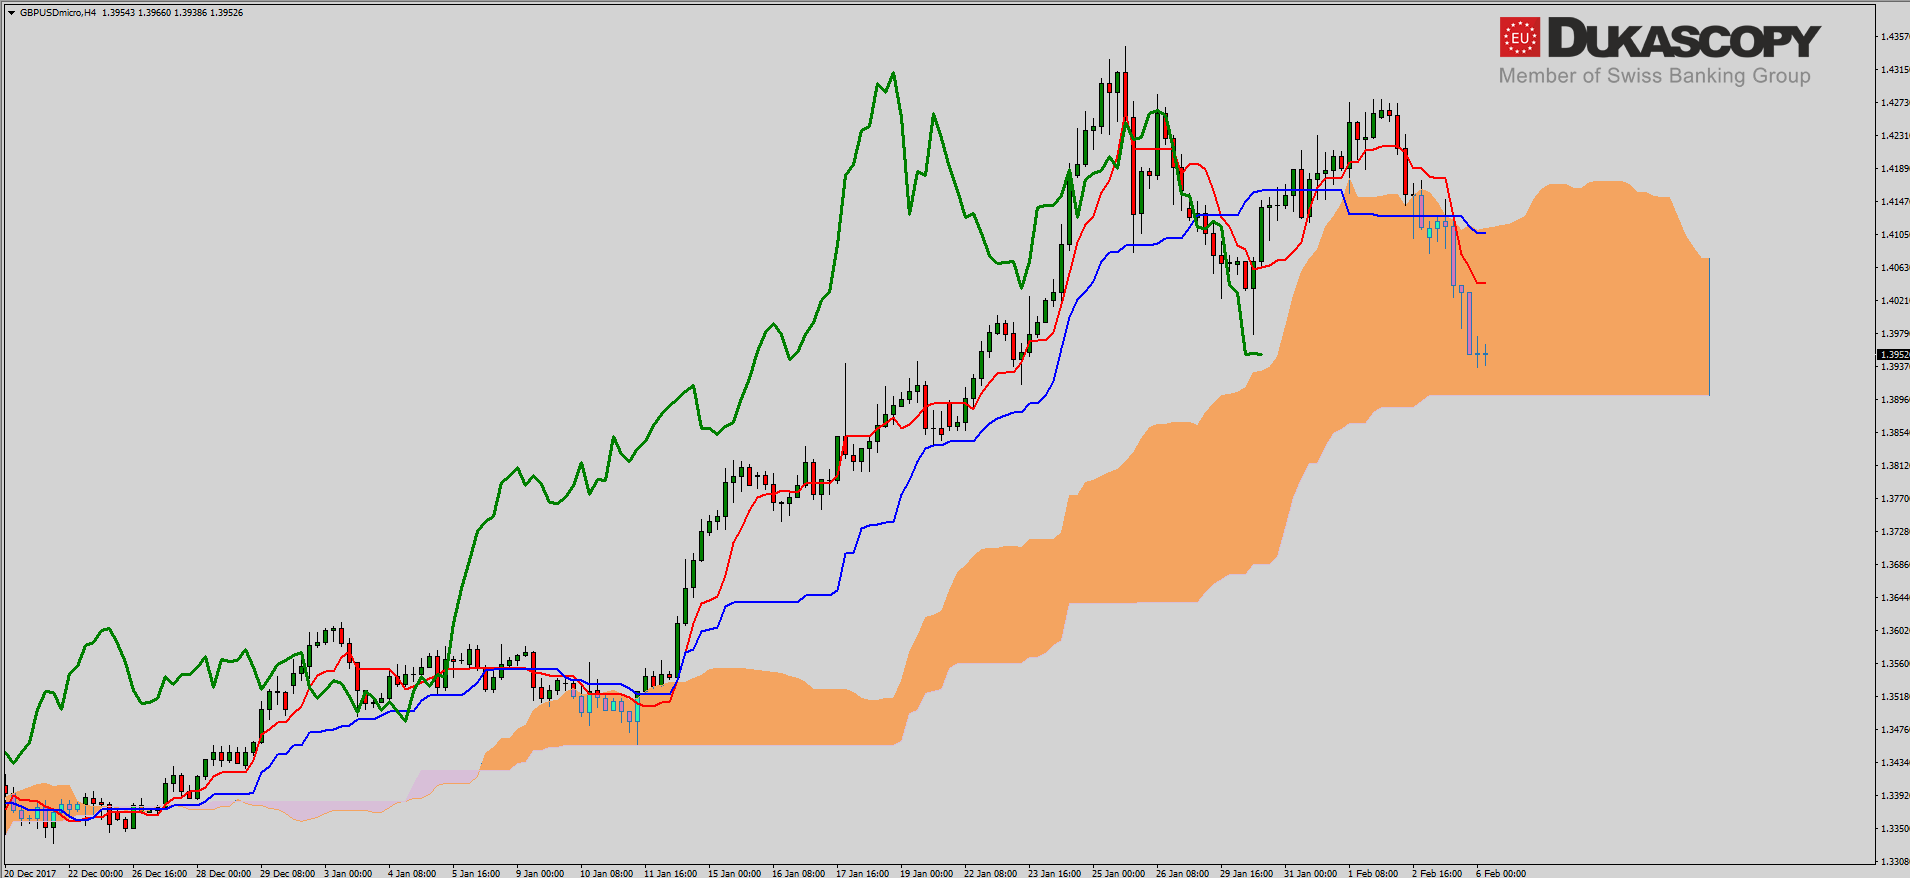
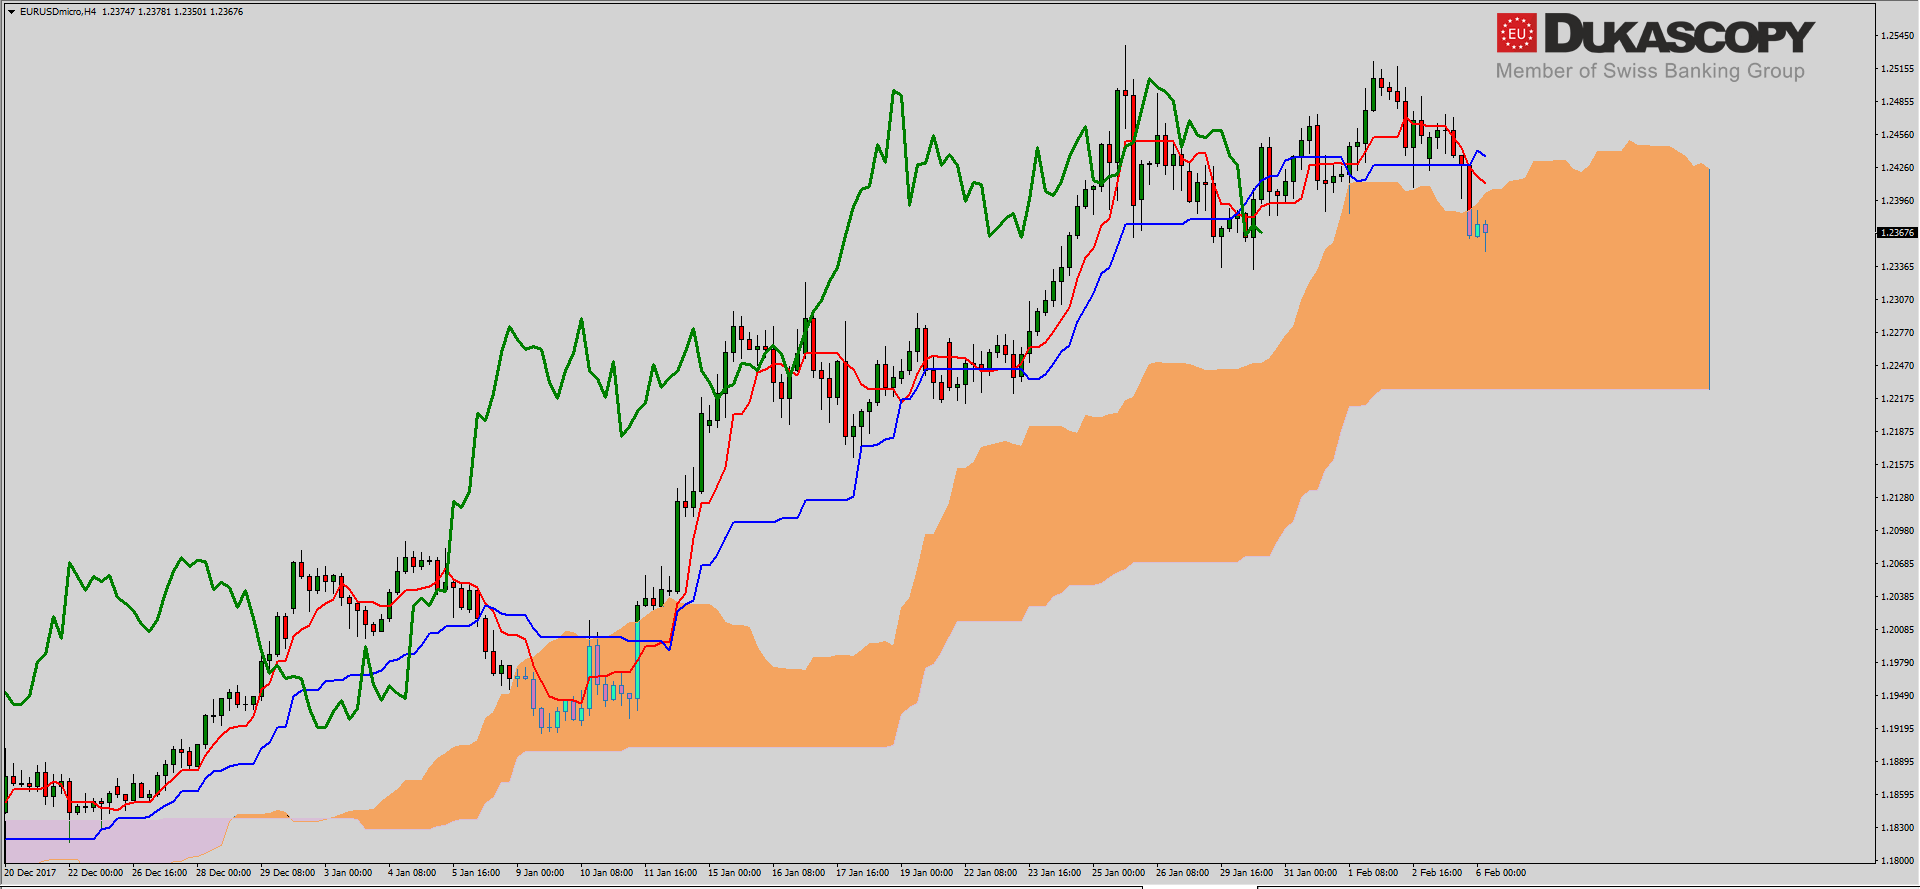 As we can see on the Ichimoku chart, the pair, after defeating the Kijun line, which was defended several times, reached the cloud. If the pair draws the triangle as the fourth wave, then we should “slip” along the Senkou Span A. If the correction is to be deeper, the price may attracted by the level determined by the flat line Senkou Span B.
 GBP/USD similar to the pair EUR/USD didn’t manage to overcome the resistance zone and after we rejected it we are watching declines. The pair defeated the support line led on the tops and is currently struggling with the support zone. The ABC correction is made, or only the A wave. In the second case the wave B is just a fifth broken wave. If so, then we should see the correction attempt and then the C wave.
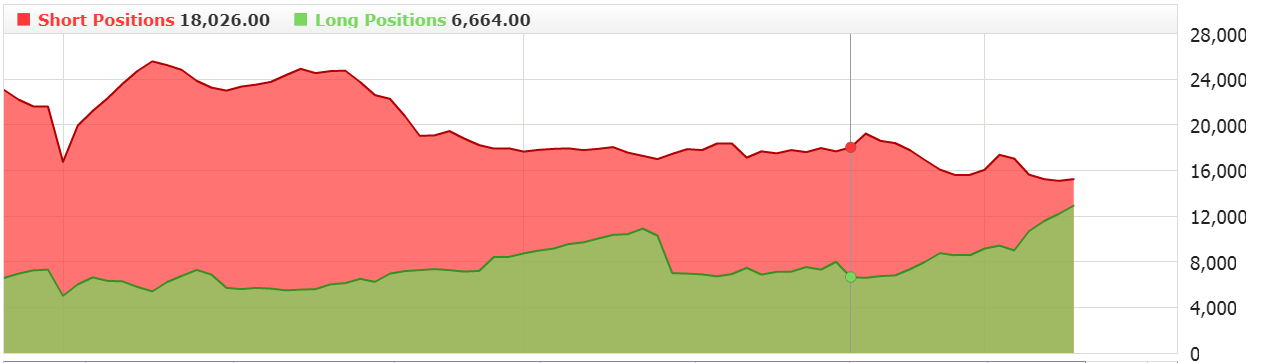
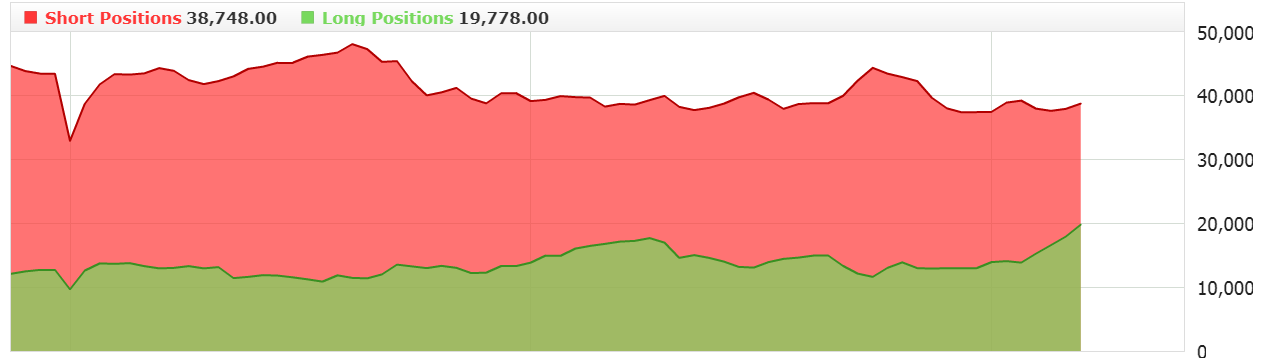
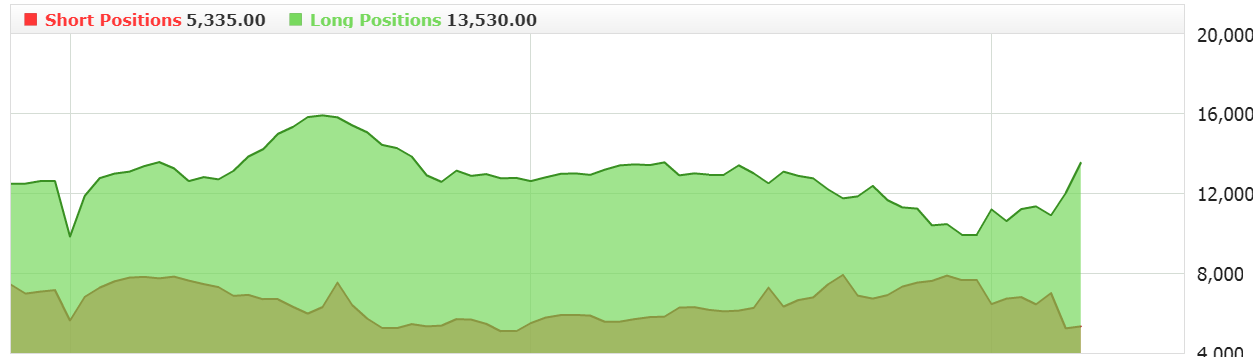
In the case of this pair on the sentiment graph, we can see a more dynamic growth of long positions. Just a little more and we will see the balance in the number of positions. Of course, the system allows you to look for a long position.
 On the weekly chart, the pair reached the recently broken line of Senkuo Span B in the bearish cloud. This line can stop further drops because it works like support. On the daily chart, the pair is also approaching the important support of the Kijun line. The area around the flat line Senkou Span B from H4 is just a Kijun line from the daily chart. There is a high probability that the correction will test these lines.
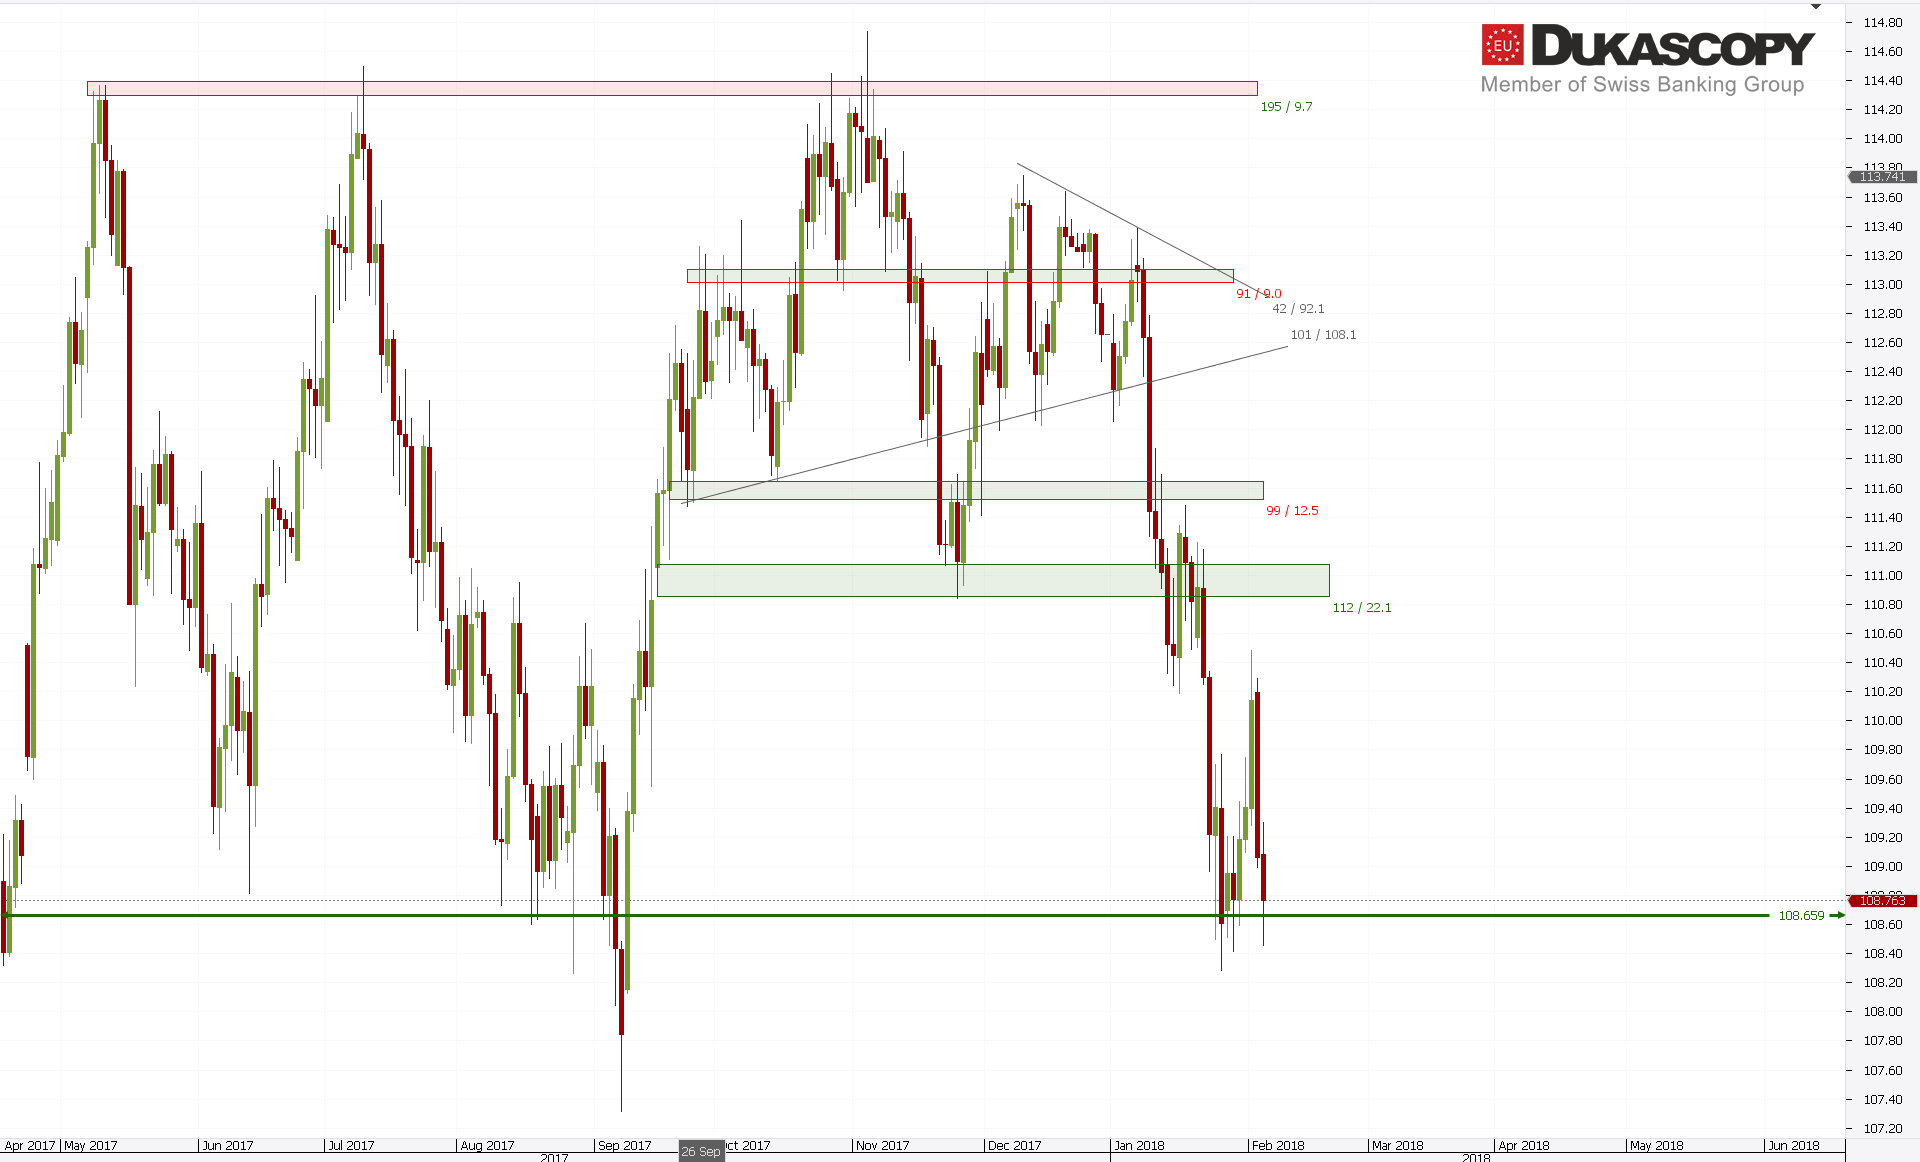
A large bullish adjustment of recent declines appeared on USD/JPY. However, the supply quickly brought the pair’s chart to support. This is a very important support and you have to wait for the outcome of the price action around it. If it is overcome, we will probably see the test of the last low and the implementation of the scenario with the C wave of the simple correction.
 Changes on the sentiment chart. The number of short positions is slowly approaching “zero”. Yesterday there was a burst of long positions. I will not look for longs, so I can only observe what will happen if the tested level is defeated.


 Review")


